
What is temporal and spatial analysis?
Graphs are a natural fit for investigative use cases. Whenever you want to analyse a situation containing people, objects, locations, and events (POLE), graphs emphasising relationships between objects are your natural companion.
To gain a basic situational understanding, you need to first analyse and understand the rough shape of your data. Who is who, what is what, and how is everything in your model connected. The closer the model is to the actual reality, the more reliable will be the answers you want to get from it. Here is where you don’t want to be constrained by fixed tables (looking at you, relational databases), but you need something as alike to the real world as possible. You want a knowledge graph.
When gathering real-world data, it might be the case that you already have what you need for it. After you map and outline your data in a knowledge graph, you can add one or two additional dimensions discussed here: space and time. Adding these will bring your model closer to the real world and deepen your understanding of what is (or was) happening. And help you take the right action.
Temporal analysis examines data over time to identify patterns and trends. It is essential in fields like finance and crime investigation, allowing analysts to track event progression, forecast trends, and pinpoint critical time frames. For instance, in crime investigations, it helps determine when a crime occurred and correlate it with other time-based data, such as phone records.
Spatial analysis focuses on the geographical aspects of data, mapping and examining physical locations to identify patterns and relationships. It is crucial in urban planning and environmental science. In crime investigations, spatial analysis helps identify crime hotspots and analyze the spatial relationships between incidents, aiding in visualizing the movement and distribution of criminal activities and resources.
Spatial Analysis – Where Things Are
You have everything nicely outlined in your visualisation, on your canvas, but something is missing here. Where is everything located in the real world? Some of your nodes may have properties that contain geospatial information, such as geographic coordinates. You should then put it up for good use.
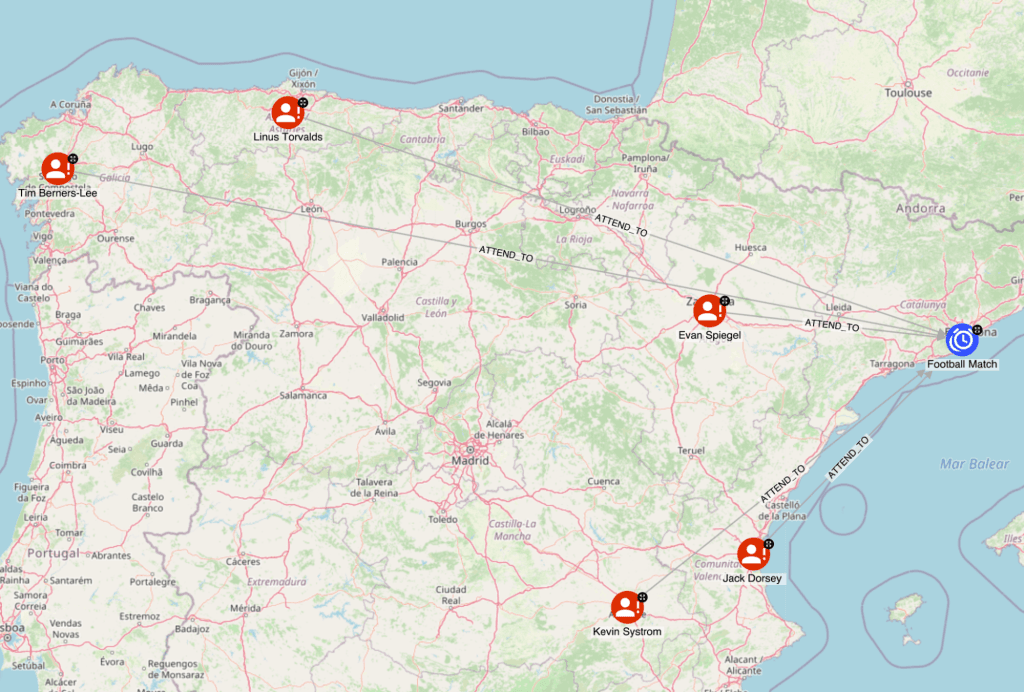
In its simplest form, Spatial Analysis is putting stuff on a map. Easy right? You will need a visualisation tool that takes the suitable properties and visualises nodes in the real world. What you are doing is combining two models. One is your knowledge graph, and the other model is the map. Once these are aligned and the coordinates of the visible map match some of your nodes, the nodes will overlay on the map.
This gives you the added dimension of understanding. Who is nearest to whom? What is in a reachable distance? Is there an interesting cluster? Maybe something suspicious is happening? Here is where your expertise comes in. Or some clever algorithm. Or maybe both.
Temporal Analysis – When Things Were
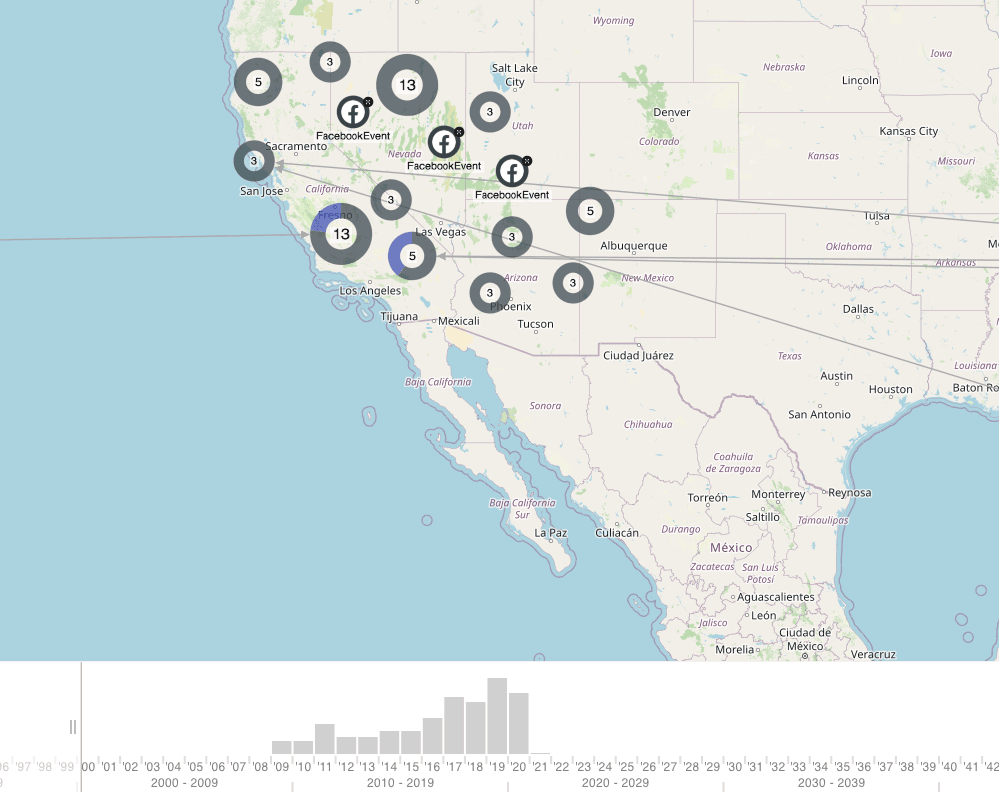
So we know where things are, or more precisely, where they were at the time the data was collected. Now, did something move or change? How did the situation evolve? For this, you will need one extra set of properties – timestamps. Again, some of your nodes might already contain them.
In the tool of our choice, we add the time bar. Now, for the selected nodes, you can see “when” they appeared on our canvas. And you can follow how the whole situation unfolded. Is there a particular event that triggered many more? This is typical for fraudulent activities. One innocent card transaction happens in time, just before many fraudulent ones. What does it tell us? You can follow this line of investigation just like we did in our recent workshop.
Combining When and Where
If our knowledge graph contains both timestamps and geospatial properties, we can combine these and dig deep into Spatiotemporal analysis. You will be able to see and analyse a real-world representation of where people or objects were at any given time and what happened where. This can answer questions like:
- Did someone meet someone else repeatedly?
- Was it feasible for someone to conduct some specific actions on multiple locations in the given time?
- Is some object’s location adjacent to one or more people as time flows?
- Who started a particular chain of events and where?
NODES2022 – Temporal Graph Analysis
The presentation discusses the temporal and spatial analysis of a dynamic graph, specifically using a COVID-19 dataset containing scientific publications. It highlights the importance of capturing the temporal evolution of a graph to analyze how the graph changes over time. By utilizing timestamps, the analysis tracks the publication of papers and the appearance of keywords chosen by authors to reflect the content of documents. This method helps to understand how scientific consensus and topics evolve.
The process involves three main steps:
- Creating monthly snapshots of the graph to represent its state at different points in time.
- Running a feature extraction algorithm to obtain topological features of nodes at each time step.
- Applying a role extraction algorithm to identify the roles each node plays in the network.
The presentation illustrates this with examples such as the rise and fall of interest in hydroxychloroquine and the increasing centrality of machine learning in COVID-19 research. It also emphasizes the broader applications of this analysis, such as tracking key individuals in a corporate network, detecting fraudulent behavior, and understanding customer behaviors. The presentation concludes with a brief Q&A session on the technical aspects of storing and processing graph snapshots.
Hume Features – Temporal & Geospatial Analysis
We explore how police investigations are revolutionized through the powerful temporal and geospatial analysis features of Hume. Investigators can quickly locate crime data by ID using the search bar, view the data node on a canvas to examine properties and connections, and utilize geospatial analysis to map out crime scenes. Pre-canned Cypher queries allow for easy retrieval of resources near the crime scene, while temporal analysis helps identify cell phones active in the area on the crime date. A case study reveals how a suspicious cell phone, belonging to a deceased person, becomes a focal point of the investigation. Further geospatial and temporal correlation of the phone’s movements aids in narrowing down suspects without requiring technical expertise. The video emphasizes the ease of use and the robust capabilities of Hume in conducting intelligence analysis.
- Quickly locate crime data by ID using the search bar
- View data nodes on a canvas to examine properties and connections.
- Utilize geospatial analysis to map crime scenes and find nearby resources.
- Employ pre-canned Cypher queries for simple data retrieval.
- Conduct temporal analysis to identify cell phones active on the crime date.
- Case study example of identifying a suspicious cell phone linked to a deceased person.
- Correlate cell phone movements over time and map their locations.
- Benefit from clustering to understand node concentrations and types.
- Perform comprehensive data analysis without technical knowledge or coding.
- Please watch our video below for more information.
What are the advantages of temporal and spatial analysis?
Graph visualization has many advantages, such as:
- Temporal analysis helps identify patterns and trends in criminal activity over time, enabling proactive resource allocation and intervention strategies.
- Spatial analysis allows for the visualization of crime data on maps, facilitating the identification of crime hotspots and areas with heightened risk.
- By correlating crime data with environmental, socioeconomic, and infrastructural factors, agencies can develop targeted crime prevention strategies.
- These analytical approaches empower law enforcement to make data-driven decisions, enhancing situational awareness and improving overall public safety.
- Historical data analysis aids in predicting future occurrences of criminal activity, enabling agencies to allocate resources effectively and efficiently.
How does temporal and spatial analysis help intelligence agencies and police?
Temporal and spatial analysis offer several advantages for intelligence agencies and police departments in their investigative and preventive efforts. Firstly, these analyses provide a deeper understanding of the temporal patterns of criminal activities, allowing law enforcement to identify trends, predict future occurrences, and allocate resources more effectively. By analyzing historical data over time, agencies can detect patterns such as seasonal fluctuations in crime rates or recurring criminal behavior at specific times, enabling them to deploy patrols or interventions proactively. Secondly, spatial analysis allows agencies to visualize crime data on maps, facilitating the identification of crime hotspots, trends in geographical distribution, and areas with heightened risk. This spatial perspective enables law enforcement to target resources and interventions in areas where they are most needed, improving response times and overall effectiveness. Additionally, temporal and spatial analysis can reveal correlations between different types of crimes or between criminal activities and environmental factors, socioeconomic conditions, or infrastructure, providing valuable insights for developing crime prevention strategies and allocating resources strategically. Overall, these analytical approaches empower law enforcement agencies to make data-driven decisions, enhance situational awareness, and ultimately improve public safety and security in communities.