With today’s blog, we will dive a little bit into front-end application development. When creating complex applications, as we do in GraphAware, we need to handle large and complicated application states to present our users with correct user interfaces. Making application state predictable and explainable is one of the key challenges for the successful agile frontend development team. As we often like to point out, graphs are proving to be a successful solution to many existing problems. So, could we learn from graphs to handle application state in a more predictable manner?
Let’s start with one of the typical examples for the web: data fetching. This is definitely an example that everyone has seen at least once in a lifetime. You click a button to reveal some resource that is not downloaded by the browser yet, so while the browser is downloading your precious data, you’re presented with a spinner. And once the resource is downloaded, you are with the data you’ve requested. When something goes wrong – maybe you don’t have the correct permission to get the data – you are presented with an error message instead.
Using typescript, we could model the state as follows:
type State = {
  isLoading: boolean;
  data: any;
  error: string | undefined;
}
However, this poses a problem. We are not being explicit about the state. For example, what if isLoading is true and at the same time we have an error? Then someone reading this piece of code might get confused by the author’s intention. We could instead improve it in the following way to explicitly name each state:
type State = {
    state: 'idle'
}
| {
    state: 'loading'
}
| {
    state: 'error'
    error: string;
}
| {
    state: 'loaded'
    data: any;
}
Now that we are being specific about what resource is and isn’t available during each application state, we can use the graph approach to visualise our program. Using graphs we can visualise each state as a node and the actions as directed relationships between those nodes:
What we just outlined above is based on the idea of state-machines, which is one of the oldest concepts in computer science. And we can think about it as our small knowledge graph for the state.
Note that in the state defined above, we introduced clear constraints on the allowed actions for each state and to which state it can transition. We used state (nodes) to describe qualitative information about the system. Not everything in a computer program can be described that way. We also have quantitative information such as data or the error message. But this can be easily solved. This quantitative data can be associated with each state/node.
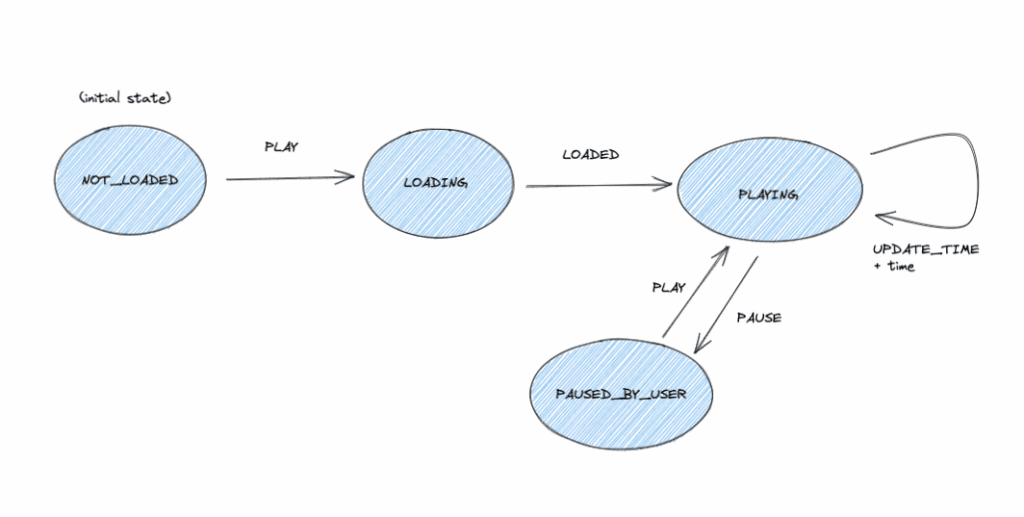
Now that we have established some basics let’s look at another example of a state machine for a video player.

Just by looking at the state, it should be clear what is happening.
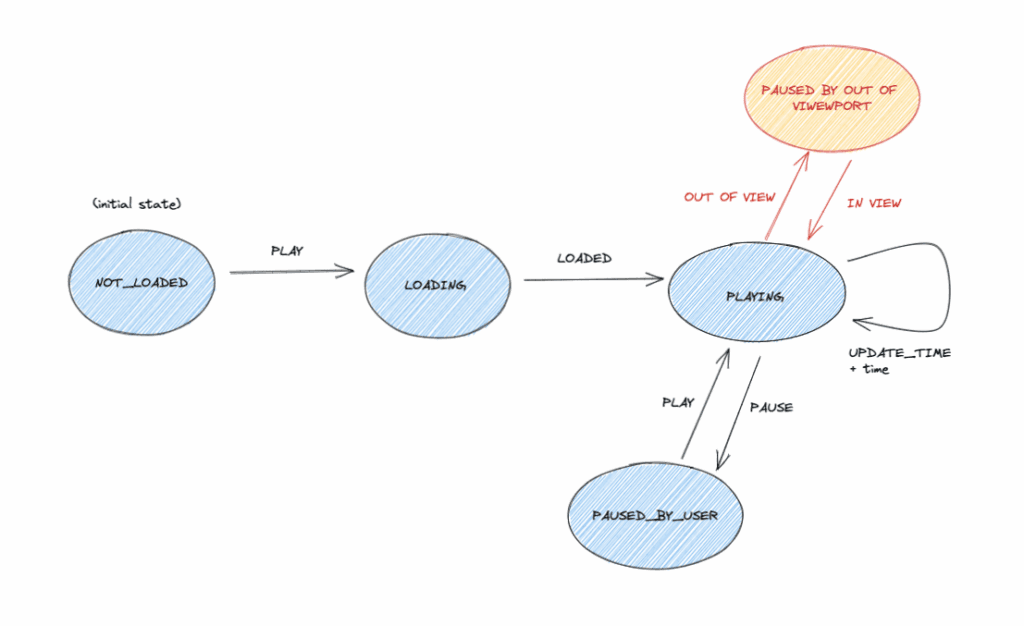
Agile software development is an ever-changing environment where software and, therefore, application state is evolving as well. And that is where this approach really shines when building new features on top of other ones. For example, we could be tasked with adding new functionality to our existing video player to pause/play the video when it gets in/out of the viewport. Still when the user pauses the video by manual action we don’t want it to play again unless the user does it again on purpose. The updated state machine could look like this:

We have created a new state (paused by out of viewport). The big benefit is that this approach forces us to think about already existing states and how the new states relate to them. It lowers the potential for bugs.
In conclusion, I’d like to point out that this approach works very well with qualitative states, so it might not be applicable when you need to deal primarily with the quantitative state (e.g. positioning nodes in a graph).
There are existing libraries such as XState helping with the implementation of this approach. You can have a look at the example implementation of the first state machine above using the XState library. But you might not need those from the start. Try to make your states explicit and when you deal with complex systems, draw yourself a graph and you’ll make life a lot easier for you and your peers.

