Enterprise Integration has existed since many, many years. Although it might seem like an old set of patterns, the reality is that more and more data silos, protocols and systems have been created in recent times which increase the need for the capabilities of an Enterprise Integration platform.
Orchestra
Orchestra is a module of the GraphAware Hume platform offering us the ability to manage and solve real business problems in the Big Data and Agile Integration space.
The natural human approach taken to solve a problem is to decompose it into simple steps, adapt some of them, get help or advice from others and orchestrate all those steps in the correct manner to achieve a final result.
The key concept used in the previous definition is the verb “orchestrate” (which is also the reasoning behind the name of Orchestra) and is exactly the approach adopted by Orchestra to help us achieve the desired result.
The power of Orchestra is its simplicity: Orchestra allows the integration of different types of data coming from multiple data sources (like S3 buckets, Azure BlobStorage, third party APIs, RDBMS tables and so on). Also, it allows for normalisation of ingested data, transforming it if necessary, and processing it with special services called Skills. Skills are where magic happens: unstructured data is transformed into knowledge.
Workflow
The key element of Orchestra is the workflow. We can think about it as a set of processing steps called components. Each of these components read incoming data (structured or unstructured), process it and produce an enriched version of the input. All these steps connected together represent a continuous knowledge enrichment pipeline.
A concrete example
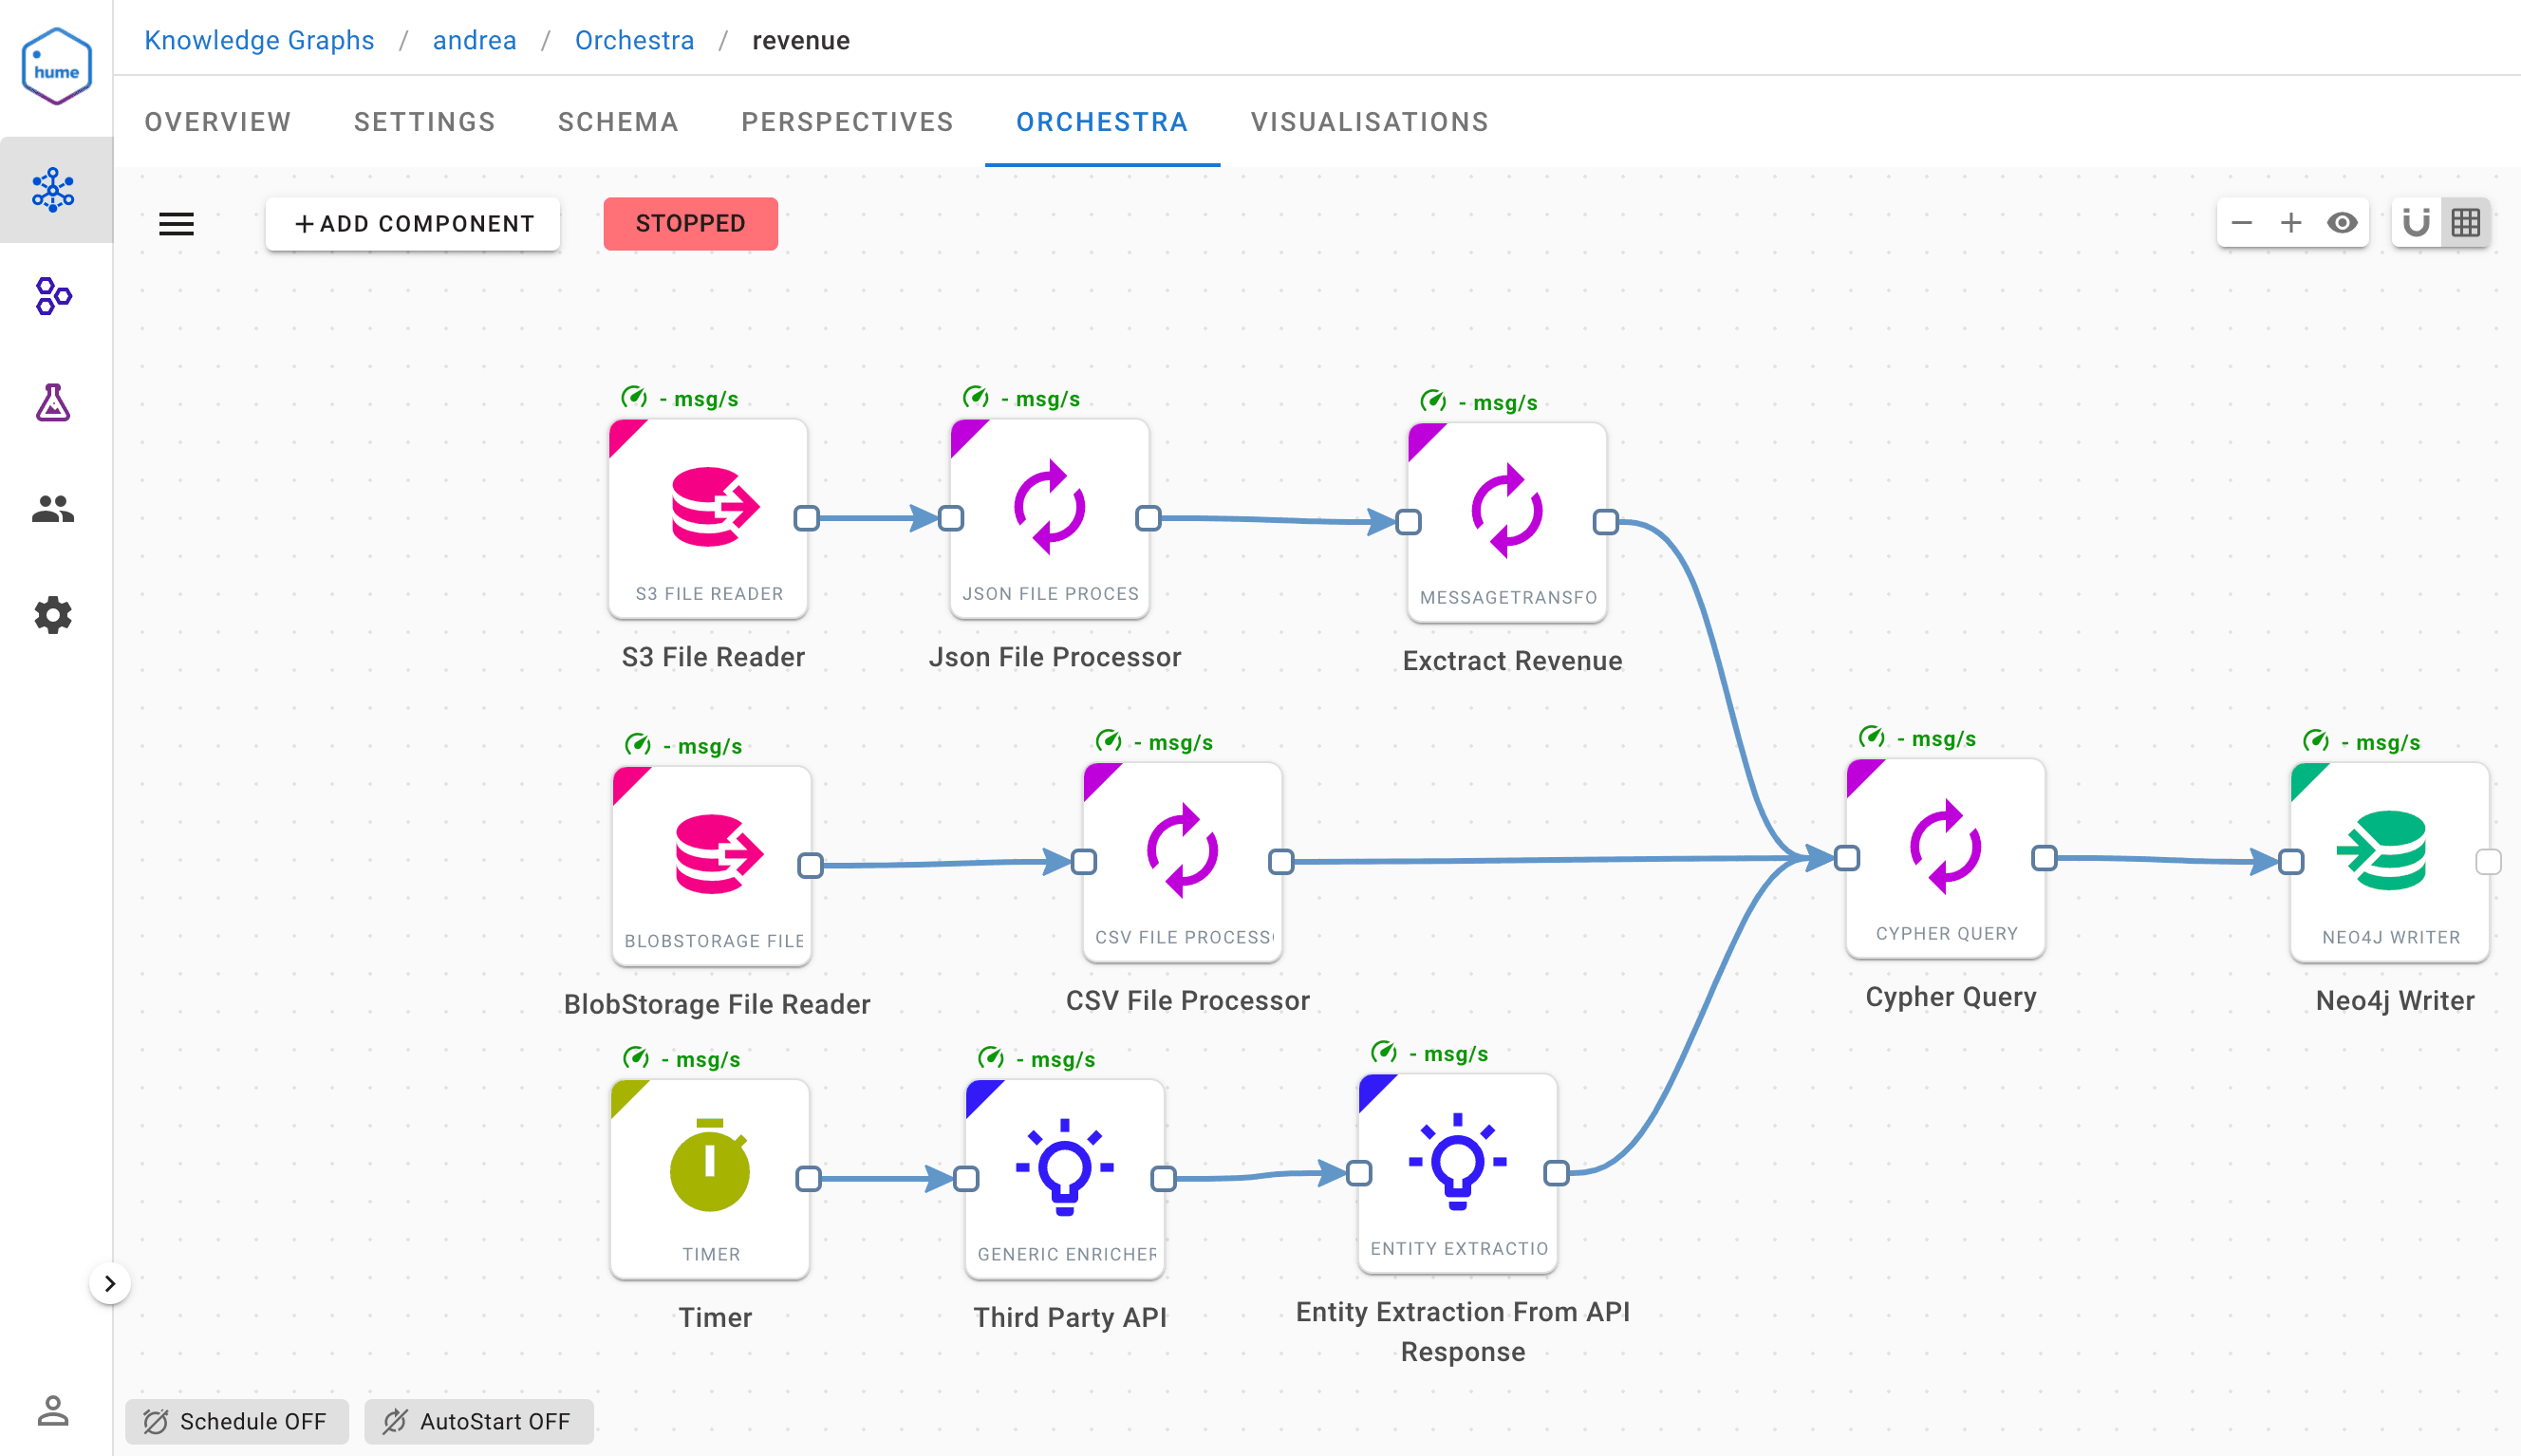
A financial institution is storing data in different formats across a multitude of silos (RSS feeds, JSON files on S3 buckets and CSV on Azure BlobStorage and third party APIs) and need to retrieve key information about the top revenue coming from their products promoted in different countries and store the results of the analysis in the form of a graph in Neo4j in order to provide a 360 degree customer view.

The above picture represents the integration of many heterogeneous data silos into one unified form that will be used to create a Knowledge Graph around it.
Enterprise data integration is not a trivial task. Orchestra is abstracting the complexity of the different connection mechanisms and protocols as well as the orchestration between those in order to let humans focus on the value of the data transformation and enrichment concerns.
To summarise, Orchestra lets you create complex workflows in a matter of minutes and drag-and-drops instead of weeks of programming.
Orchestra can handle any amount of data and is also leveraging cloud infrastructure constructs such as Kubernetes.
If you think nothing will go wrong, it will!
A number of issues can happen during the lifecycle of a workflow.
As an example, the workflow illustrated above includes an RSS Feed component as source input. The following non-exhaustive list enumerates various situations where an error can occur :
- The text size of the feed content exceeds the Neo4j max size of text with a particular indexing strategy
- The RSS feed becomes unreachable
- The virtual machine on which Orchestra is installed runs out of disk space or memory
Errors can be predictable or unpredictable, but they have, unfortunately, a common factor:
They introduce an impact to a critical operational capability of the business.
Orchestra provides components that are able to manage errors (failure handlers). They use retry logic to send alerts to several channels, like email, Slack and so on. Failure handlers can also be configured as a chain so you have a redundancy in the error handling as well.
Error handling is of course the first layer of defense in application reliability but is limited to logic executed during the runtime of the application. When an application shuts down for an unmanaged reason, external systems need to be aware of this event in order to take appropriate action. This is where “system observability” is coming into place.
System Observability
Metrics are a numeric representation of data measured over intervals of time. Metrics can harness the power of mathematical modeling and prediction to derive knowledge of the behavior of a system over intervals of time in the present and future.
Distributed Systems Observability, Cindy Sridharan
This makes metrics perfectly suited to building dashboards that reflect historical trends where metrics with traces and logs are one of the three pillars.
The next section explains how Orchestra fits in a system-wide monitoring infrastructure.
Hume Monitoring
The Hume platform provides a specific module called “Hume Monitoring” , which is capable of addressing all of these problems. It uses Prometheus as the time series database and Grafana as a metrics watcher.
Prometheus comes with great metric types like counters, gauges, histograms and summaries. In the Hume Monitoring module, new custom metrics have been introduced to represent the concept of workflows.
Metrics customisations allow Hume Monitoring to produce a set of dynamic values like the name of the workflow and the kind of event produced (error or message) fitting perfectly with the concept of templating and repetition in Grafana.
In such a way a new panel is automatically generated every time a new workflow is started in Orchestra, and removed when the workflow is stopped.
Hume Monitoring includes customizable dashboards with extremely useful indicators about
- system loads
- CPU utilization
- request throughput
- number of workflows running over all the Orchestra instances
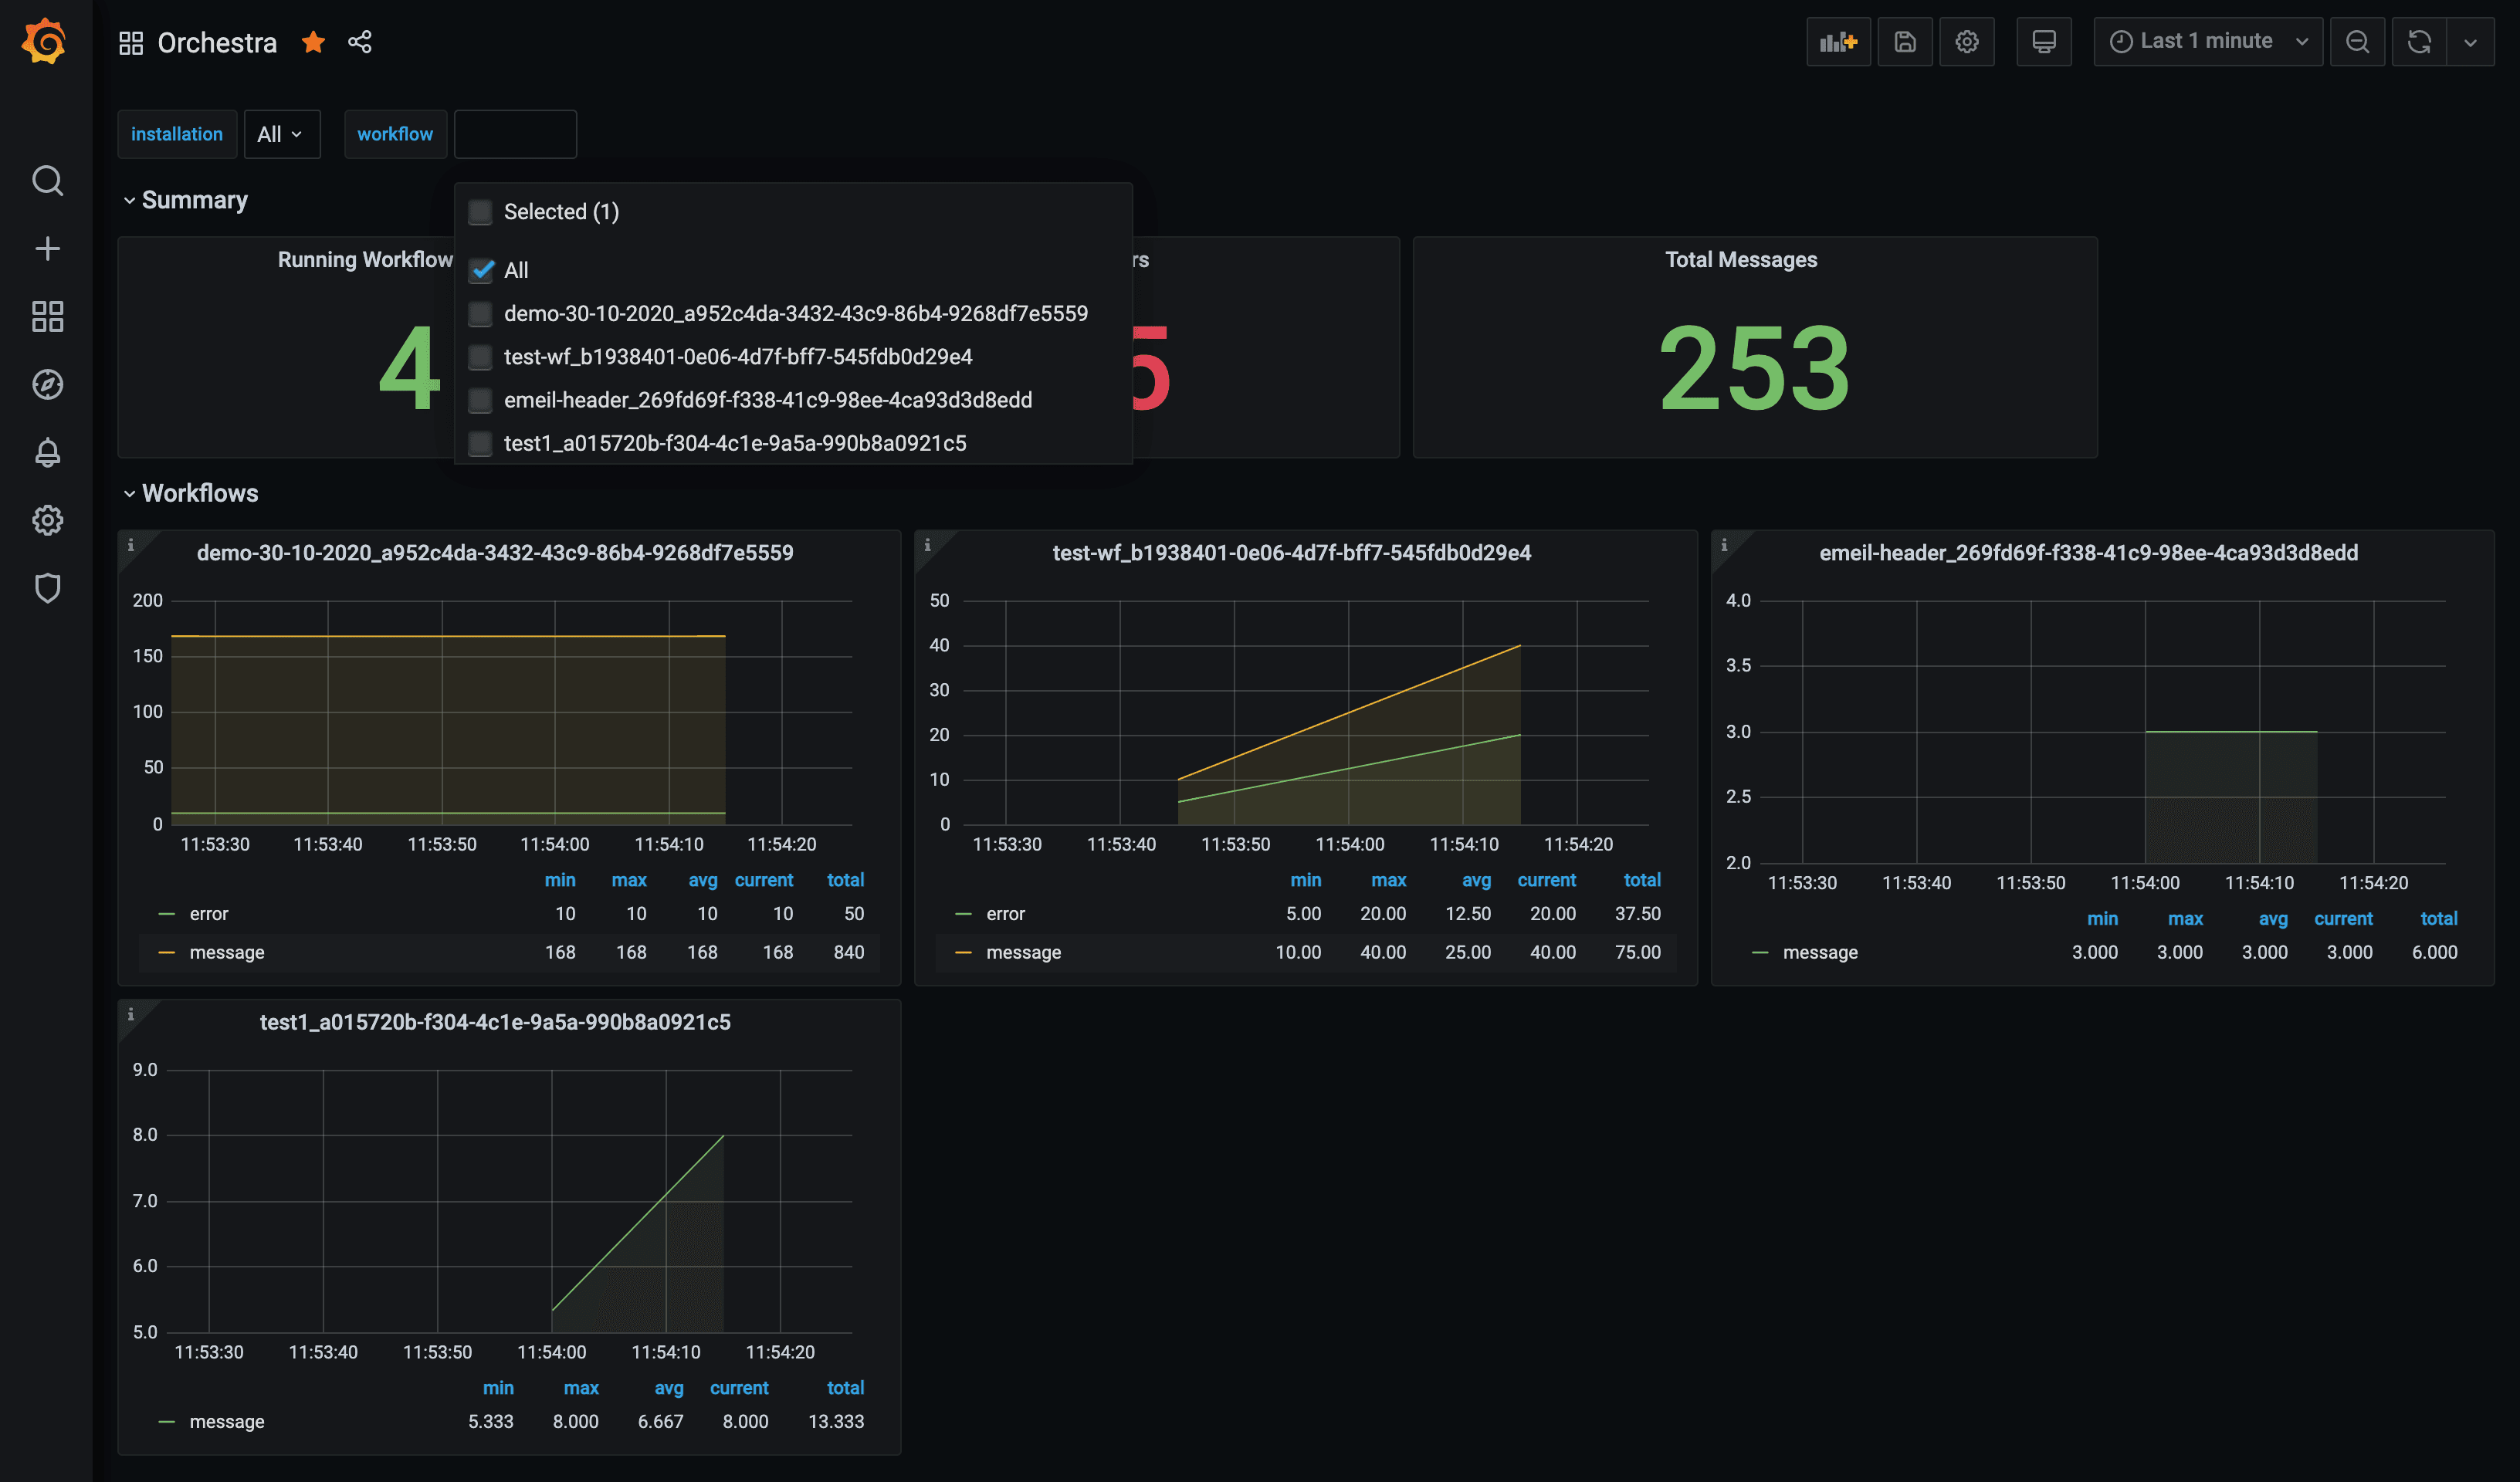
- a detailed view for each running workflow that shows messages and errors over time
The biggest benefit of adopting this approach is that we have a single point where we can verify how Orchestra is performing and be alerted when something goes wrong, regardless of the physical location of Orchestra and if it’s running or not.
Here are some dashboard examples:
In the picture below we can easily identify how many workflows are currently running, the total number of errors and messages for all workflows. For each workflow a linear graph is displayed for the number of messages/errors over the time.

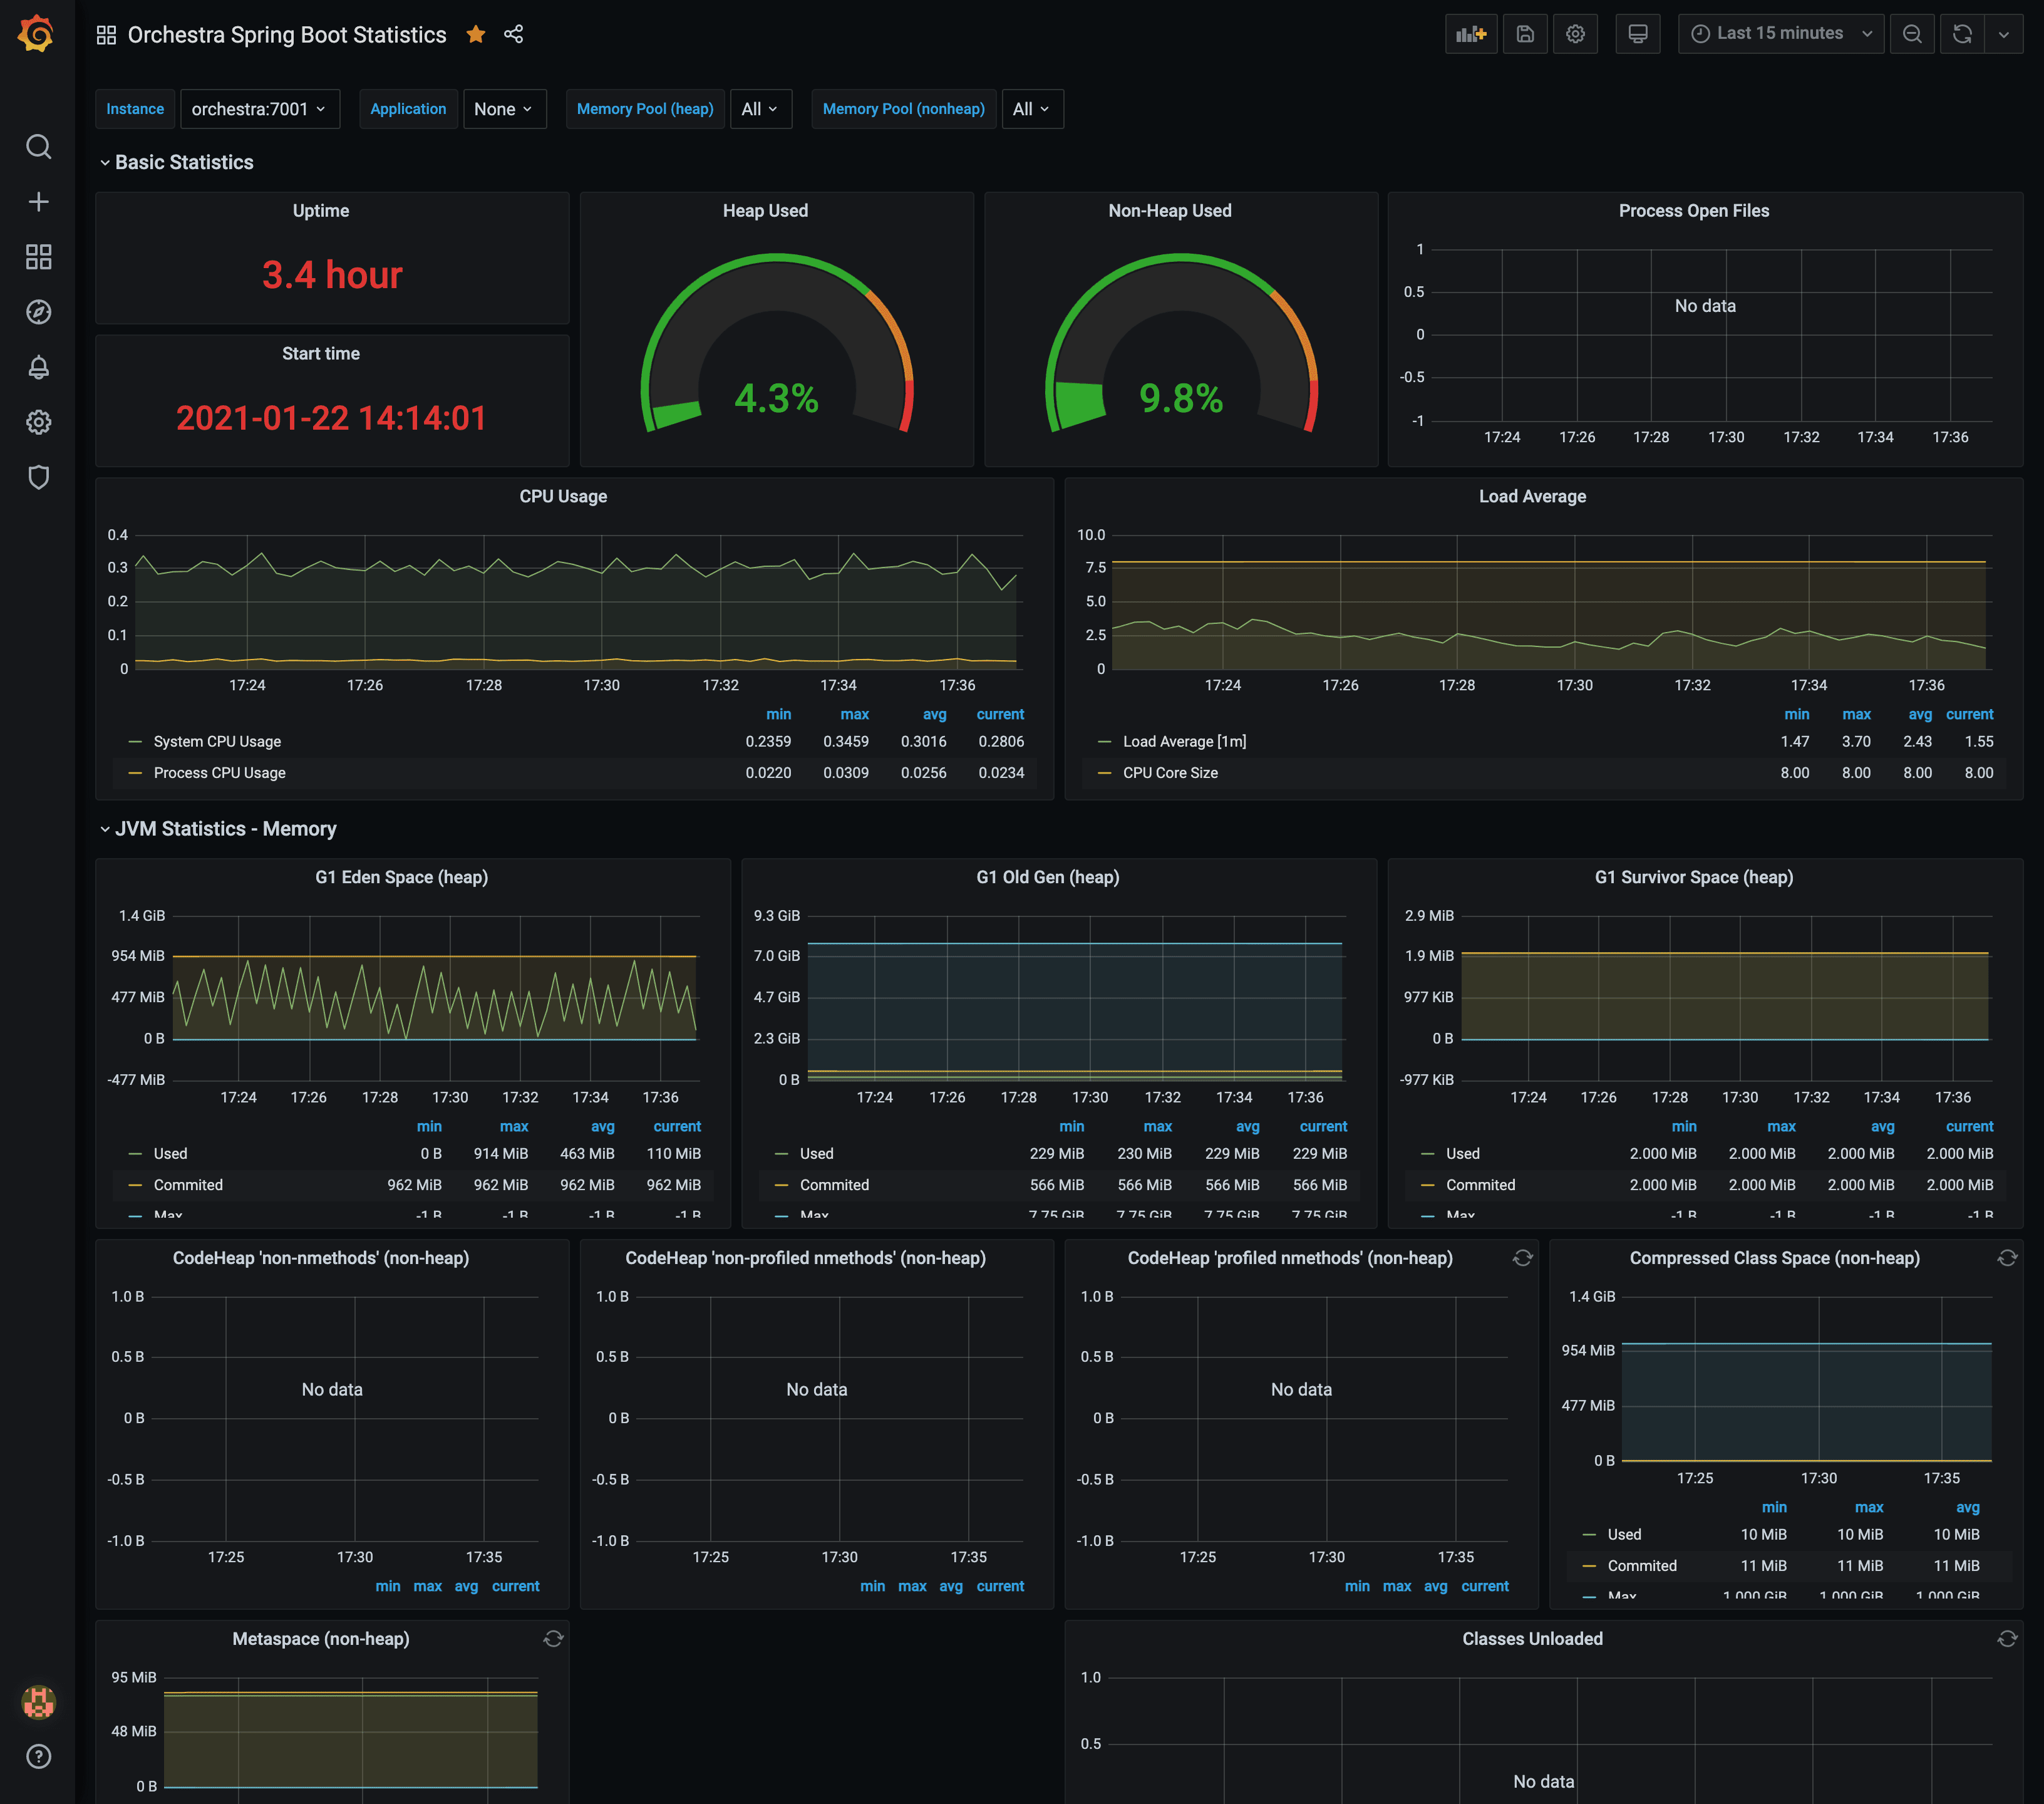
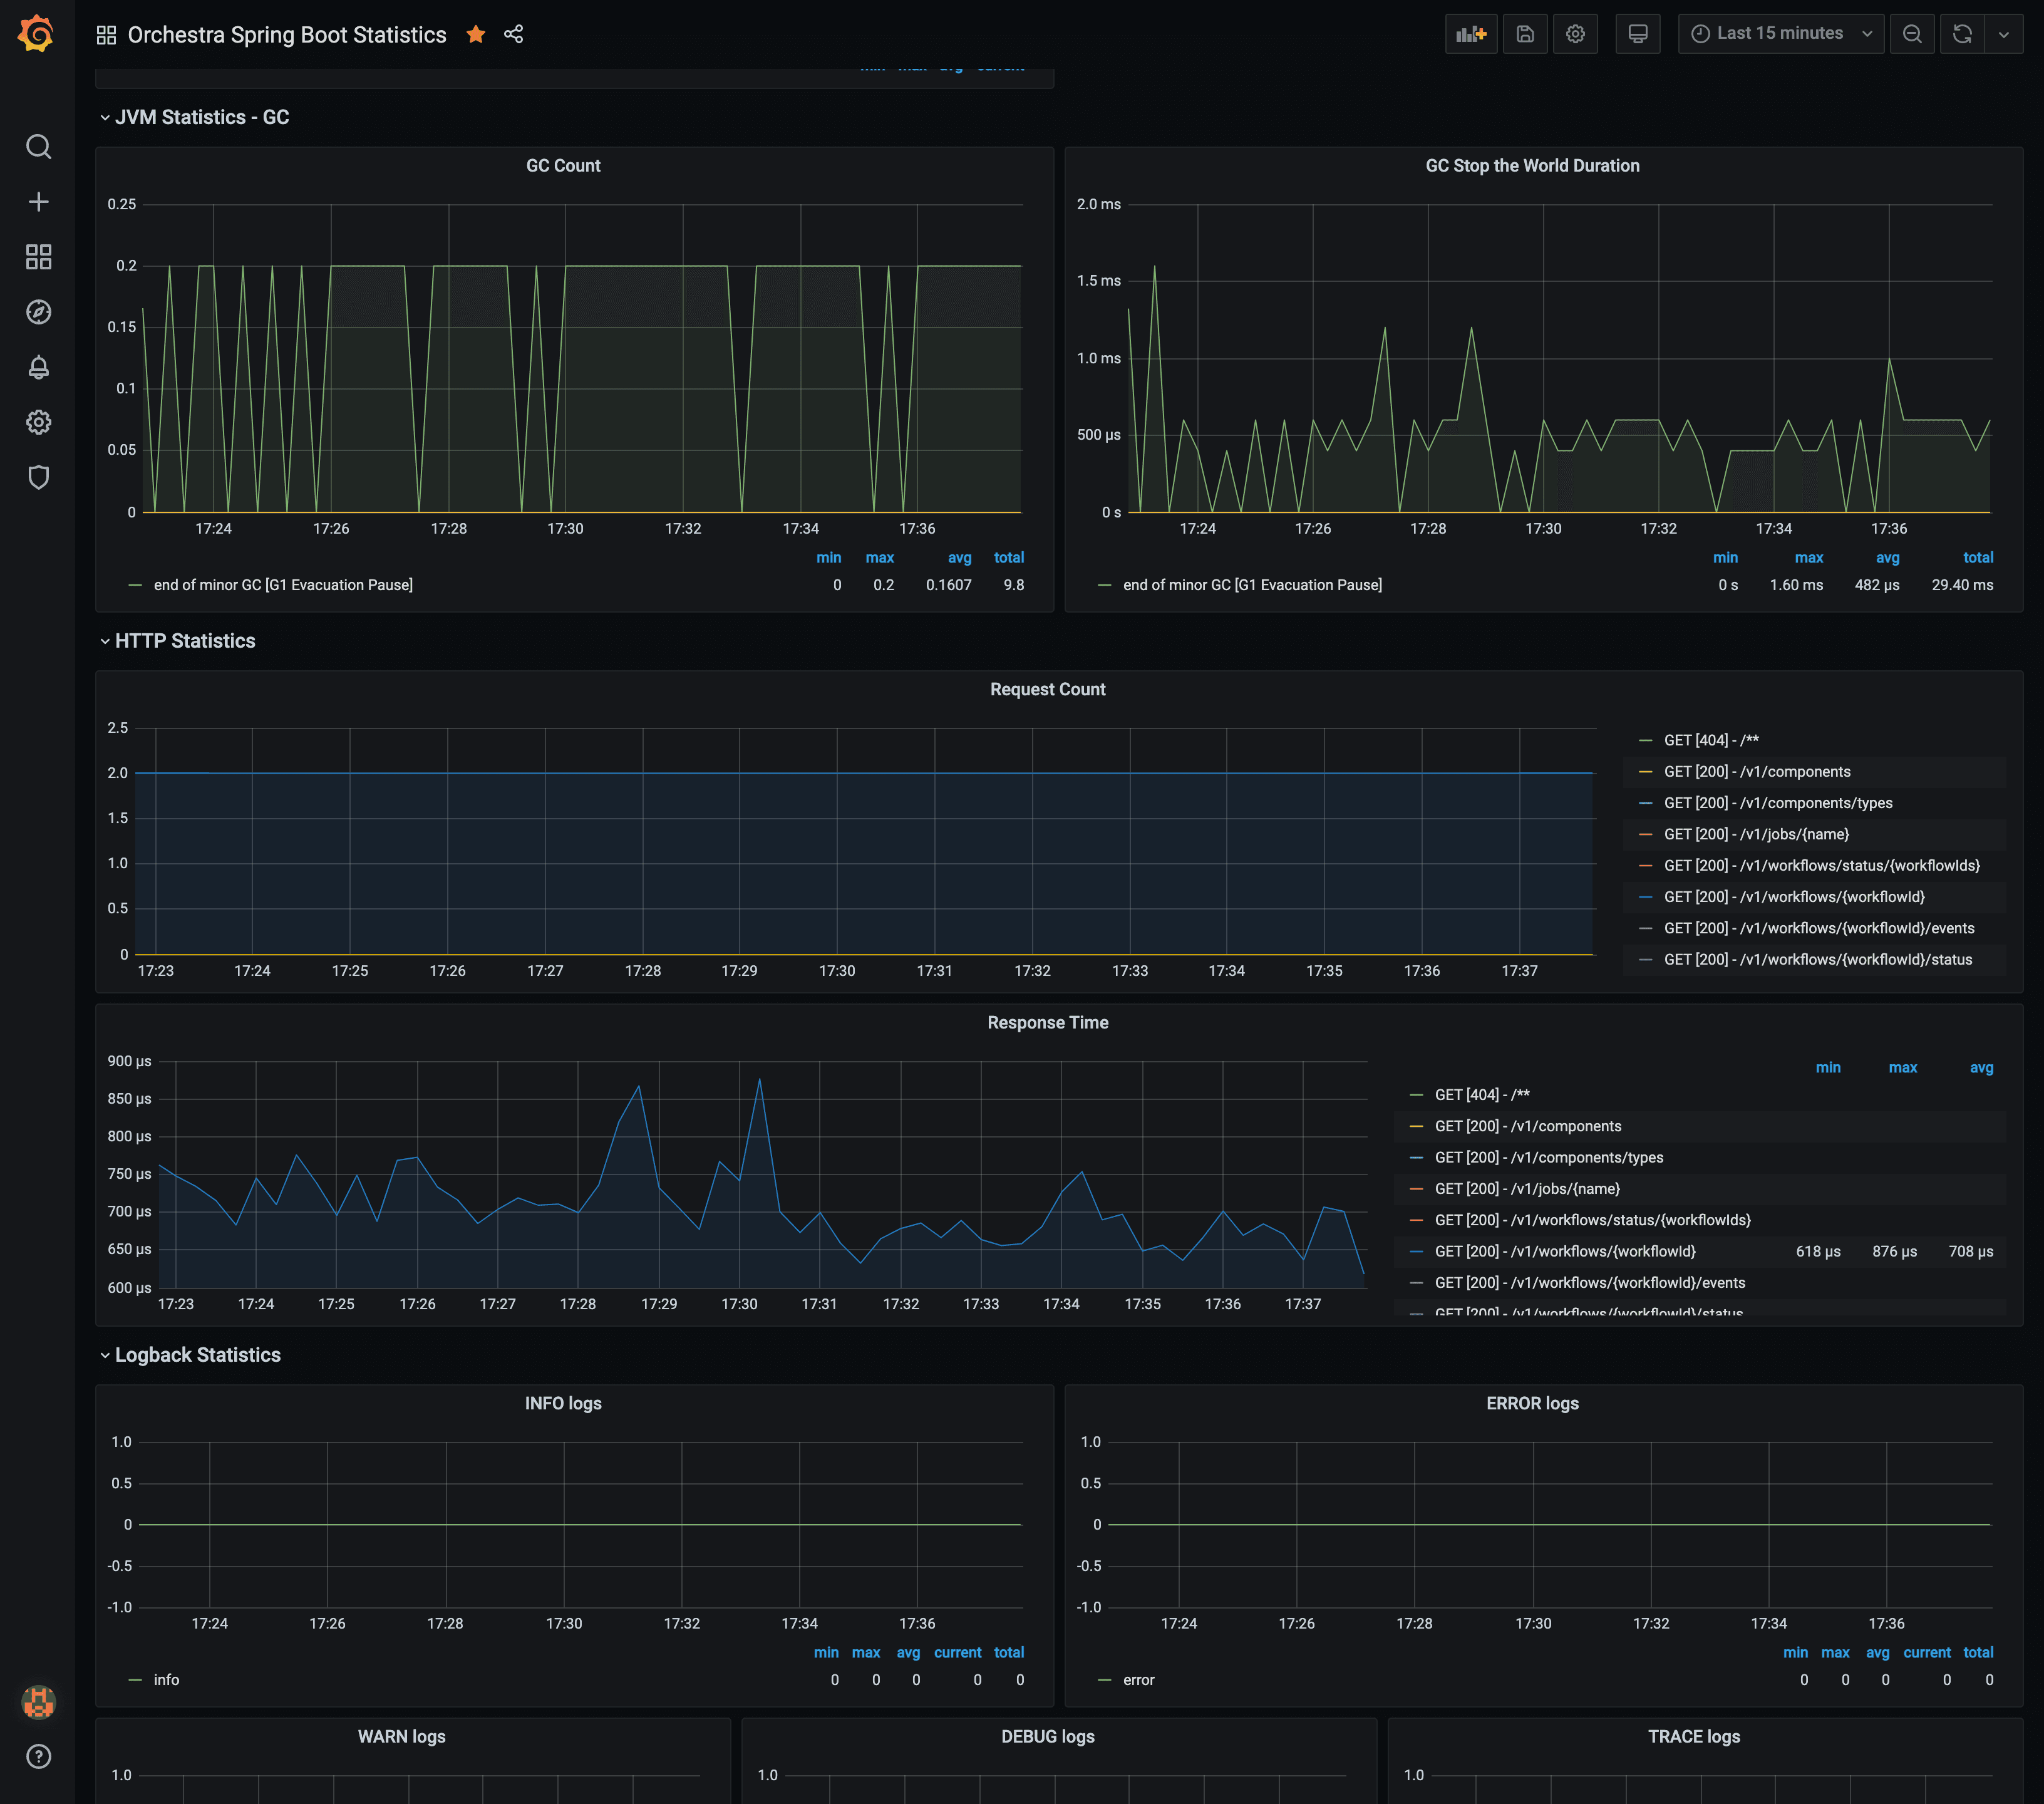
In the following dashboard we can see the impact in terms of resources consumed, number of requests per second, JVM statistics, CPU utilization and error logs.


Monitoring is an essential module for the entire lifecycle of an infrastructure. It gives insights on our running applications, how they’re being utilized and how they’re growing. Thanks to Hume Monitoring we can prevent problems, take actions immediately and ensure our business doesn’t suffer losses.
Conclusion
This is the first in a series of blog posts about the Hume platform, where we talk about its various tools and reliability. Learn how Hume not only helps you build knowledge from data where key information is not immediately visible, but also to investigate if unexpected errors are occurring at any given moment.
Don’t hesitate to register to our newsletter for upcoming blog posts on this topic.

