In July, we released GraphAware Hume 2.24. It introduced the world to a new method of advanced intelligence visualisation – thanks to the capability of creating customisable Dashboards with Action Boards. They allow users to have a unified view of information from within the graph and from external sources. This capability allows users to integrate information from external sources or view information that may only be allowed to query on the fly.
Today, we’re going to explore Action Boards in more depth with the CEO of GraphAware, Michal Bachman, and the Head of Product at GraphAware, Miro Marchi.
Michal, how did GraphAware’s pivot towards more law enforcement-focused industries inform the development of Action Boards?
Michal Bachman: On a high level, we realised, especially in intelligence analysis, that while a graph is the perfect structure for intelligence data because it’s interconnected, graph visualisation is not always the best way to present the data. It’s not always the best way to interpret intelligence findings. Sometimes you want to have a holistic view of an entity, which could be a person, a location, a vehicle, or a summarised view of a set of entities, like an entire organisation, say a criminal organisation.
We have a history of working on intel analysis software even before GraphAware Hume was born. We were building software for customers based on Neo4j, and some of those customers were using the software for intelligence analysis or criminal intelligence analysis. In building these tools, we always included some sort of profile view or summary view of an entity. We realised this is very useful for our customers, and we wanted to build it into Hume as well. That’s how Action Boards were born.
When analysts have an entity or a data point, the graph analysis tooling in Hume provides all they need. You can run graph algorithms, explore the immediate surroundings of a node manually, run selective expansion to have a view of the underlying network, analyse multi-level connections, compute risk and threat scores, and more. The graph analysis itself is probably where people spend most of their time, and it works. When you need a dashboard or a profile view, you still need to execute relatively complex graph queries, like traversals or shortest paths, but present it as an overview. This is valuable to end users because they get a quick summary of a situation or an entity, which they can export, share, or present as a report.
Why now? Why is now the time for Action Boards to come to life and not some years ago?
Michal Bachman: I think it’s because it was the most obvious missing piece for the analyst. The graph exploration and analysis user interface is really good and sufficient for people to do what they need to do.
What was missing was an interface for a summary. Sometimes, you want to have a holistic view of an entity – be it a person, location or device, and understand the context within which it exists. Customers asked for it, and enough of them did, so we decided to build it. In intelligence analysis, you need a few high-level interfaces: the graph interface, the summary interface (Action Board), and others, like a proper table view and a sophisticated search interface. The Action Board was the most urgent, but a better search interface is definitely next on the line.
How does advanced intelligence visualisation fit into the analysis process? A starting point, or endpoint — say, to generate a report?
Miro Marchi: We serve both use-cases. It’s an entry point and also a result or reporting tool. Search for the entity, show me the overview of the entity. That’s the entry point. Then they understand if this entity is important – if not, move on to the next entity.
From start to finish, you can understand if what you have in front of you is important. It’s very much an entry point, to then undergo deeper analysis. Ideally, you start with a search, have a list of possible candidates with an overview that helps you understand which one is more important. Then you have another overview specific to that collection, to understand if it is really important. Then you move to the node-link diagram, add it to your graph visualisation, and start the deep investigation.
How do Action Boards handle the disparate data sources that clients work with?
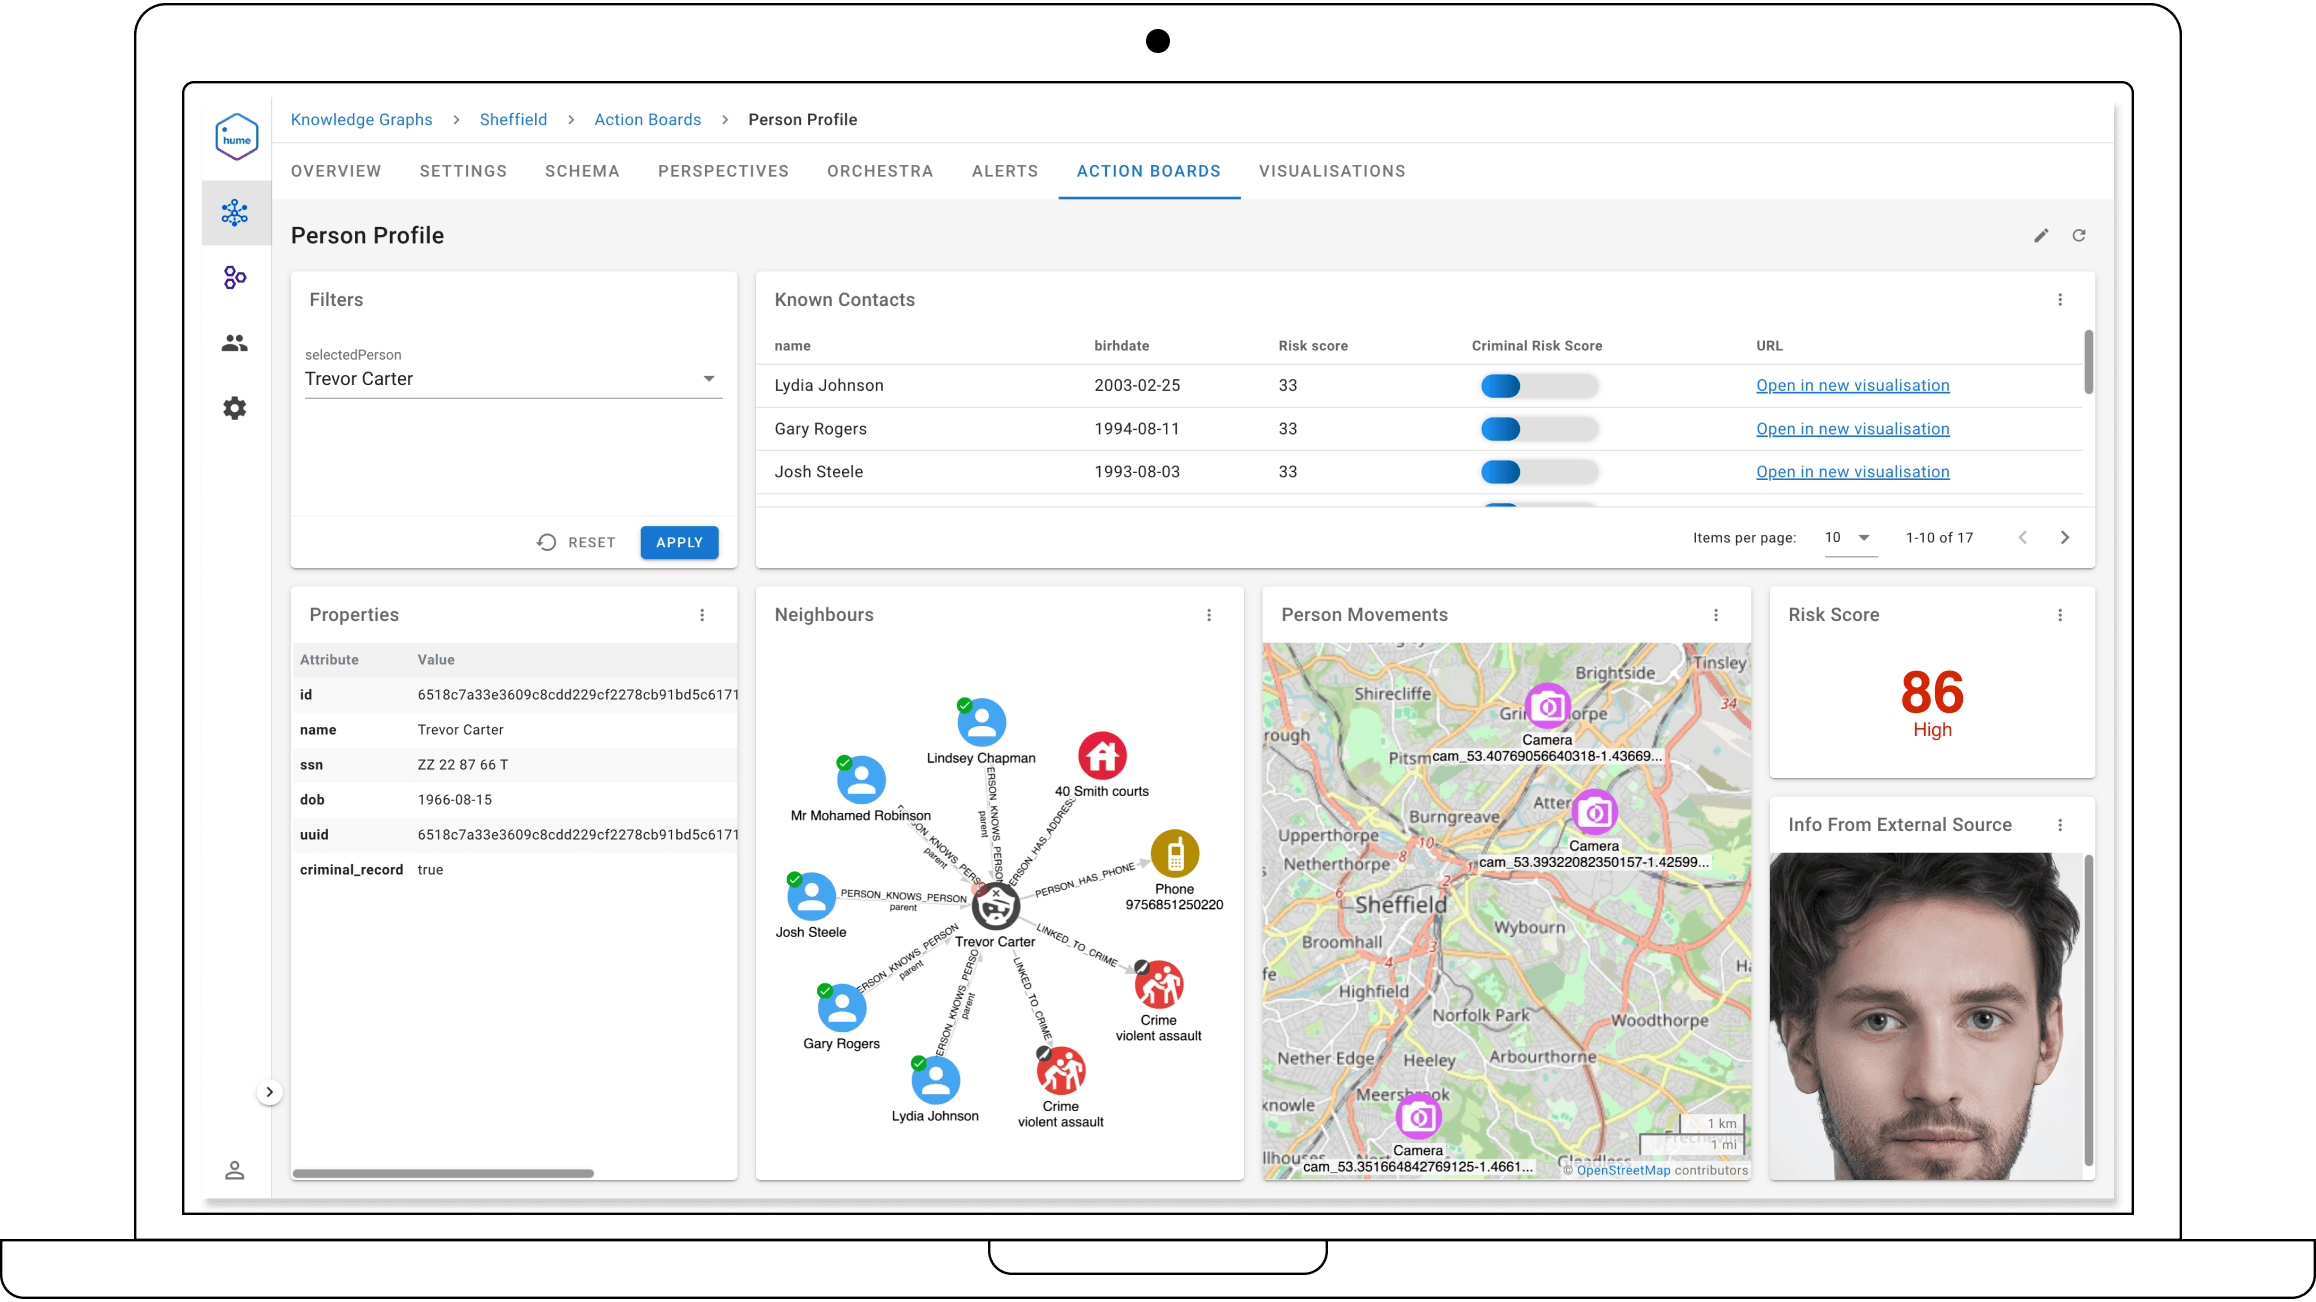
Michal Bachman: Action Boards very much fit into the overall trend we’re seeing towards federating data. Our customers don’t always own and control all the data they need for analysis. In the graph view, we can selectively bring data from other sources not controlled by the customer. The Action Board allows them to easily and transparently compose an overview of an entity or set of entities from multiple data sources or systems. For example, I may want to see a person’s profile, their picture from a third-party system, their criminal record from another system, and their social media profiles from yet another system.
You also have LLM integrations within Action Boards. What sort of benefits or use-cases does that have for advanced intelligence visualisation?
Miro Marchi: Well, a lot. We made Action Boards configurable. We have an integration of Actions with Orchestra, which interacts with LLMs. The use-cases we have seen in Action Boards using LLMs vary. We have seen generation of reports from the canvas – letting the LLM figure out what you have on the canvas, and providing a summary of what’s there. Ad-hoc reporting is another use case. You can tell the LLM, “ I have my investigation result in my canvas. Please write me a specific type of report, such as a request for further information about this case, or a police task that has to happen based on the data.” These are examples of using Action Boards at the end of the analysis process. But there are many cases – for example, data-scientists are using Action Boards to evaluate the results of LLM models in extracting entities and relationships from unstructured data.
How does advanced intelligence visualisation aid intelligence dissemination and collaboration?
Miro Marchi: Entity 360 Boards are very important, because you don’t want the user to spend time investigating how to find what’s important about an entity. You want the user to already have an overview of what’s important about an entity. If the user wants to investigate further, they can find the right Action, or query, and analyse relationships. This is very important because all our customers have two teams: technical people who configure the software, and analysts or investigators who use it to solve crimes. This feature allows techies to prepare it, and the others to use it out of the box.
So, it bridges the gap between teams?
Miro Marchi: Yes, much better than before. Before, developers could create maybe ten different Actions, but it was the job of the analyst to find out which one to use first. Now, you have an overview – a Dashboard, that is the entity profile, which kickstarts the investigation. For example, for a phone number entity, you can see how it was active through time, the main contacts, and where it was active. These could be three different actions, but instead, you put it all in the same Action Board. The information is there, and then users can decide how to use it, or what else they want to know.
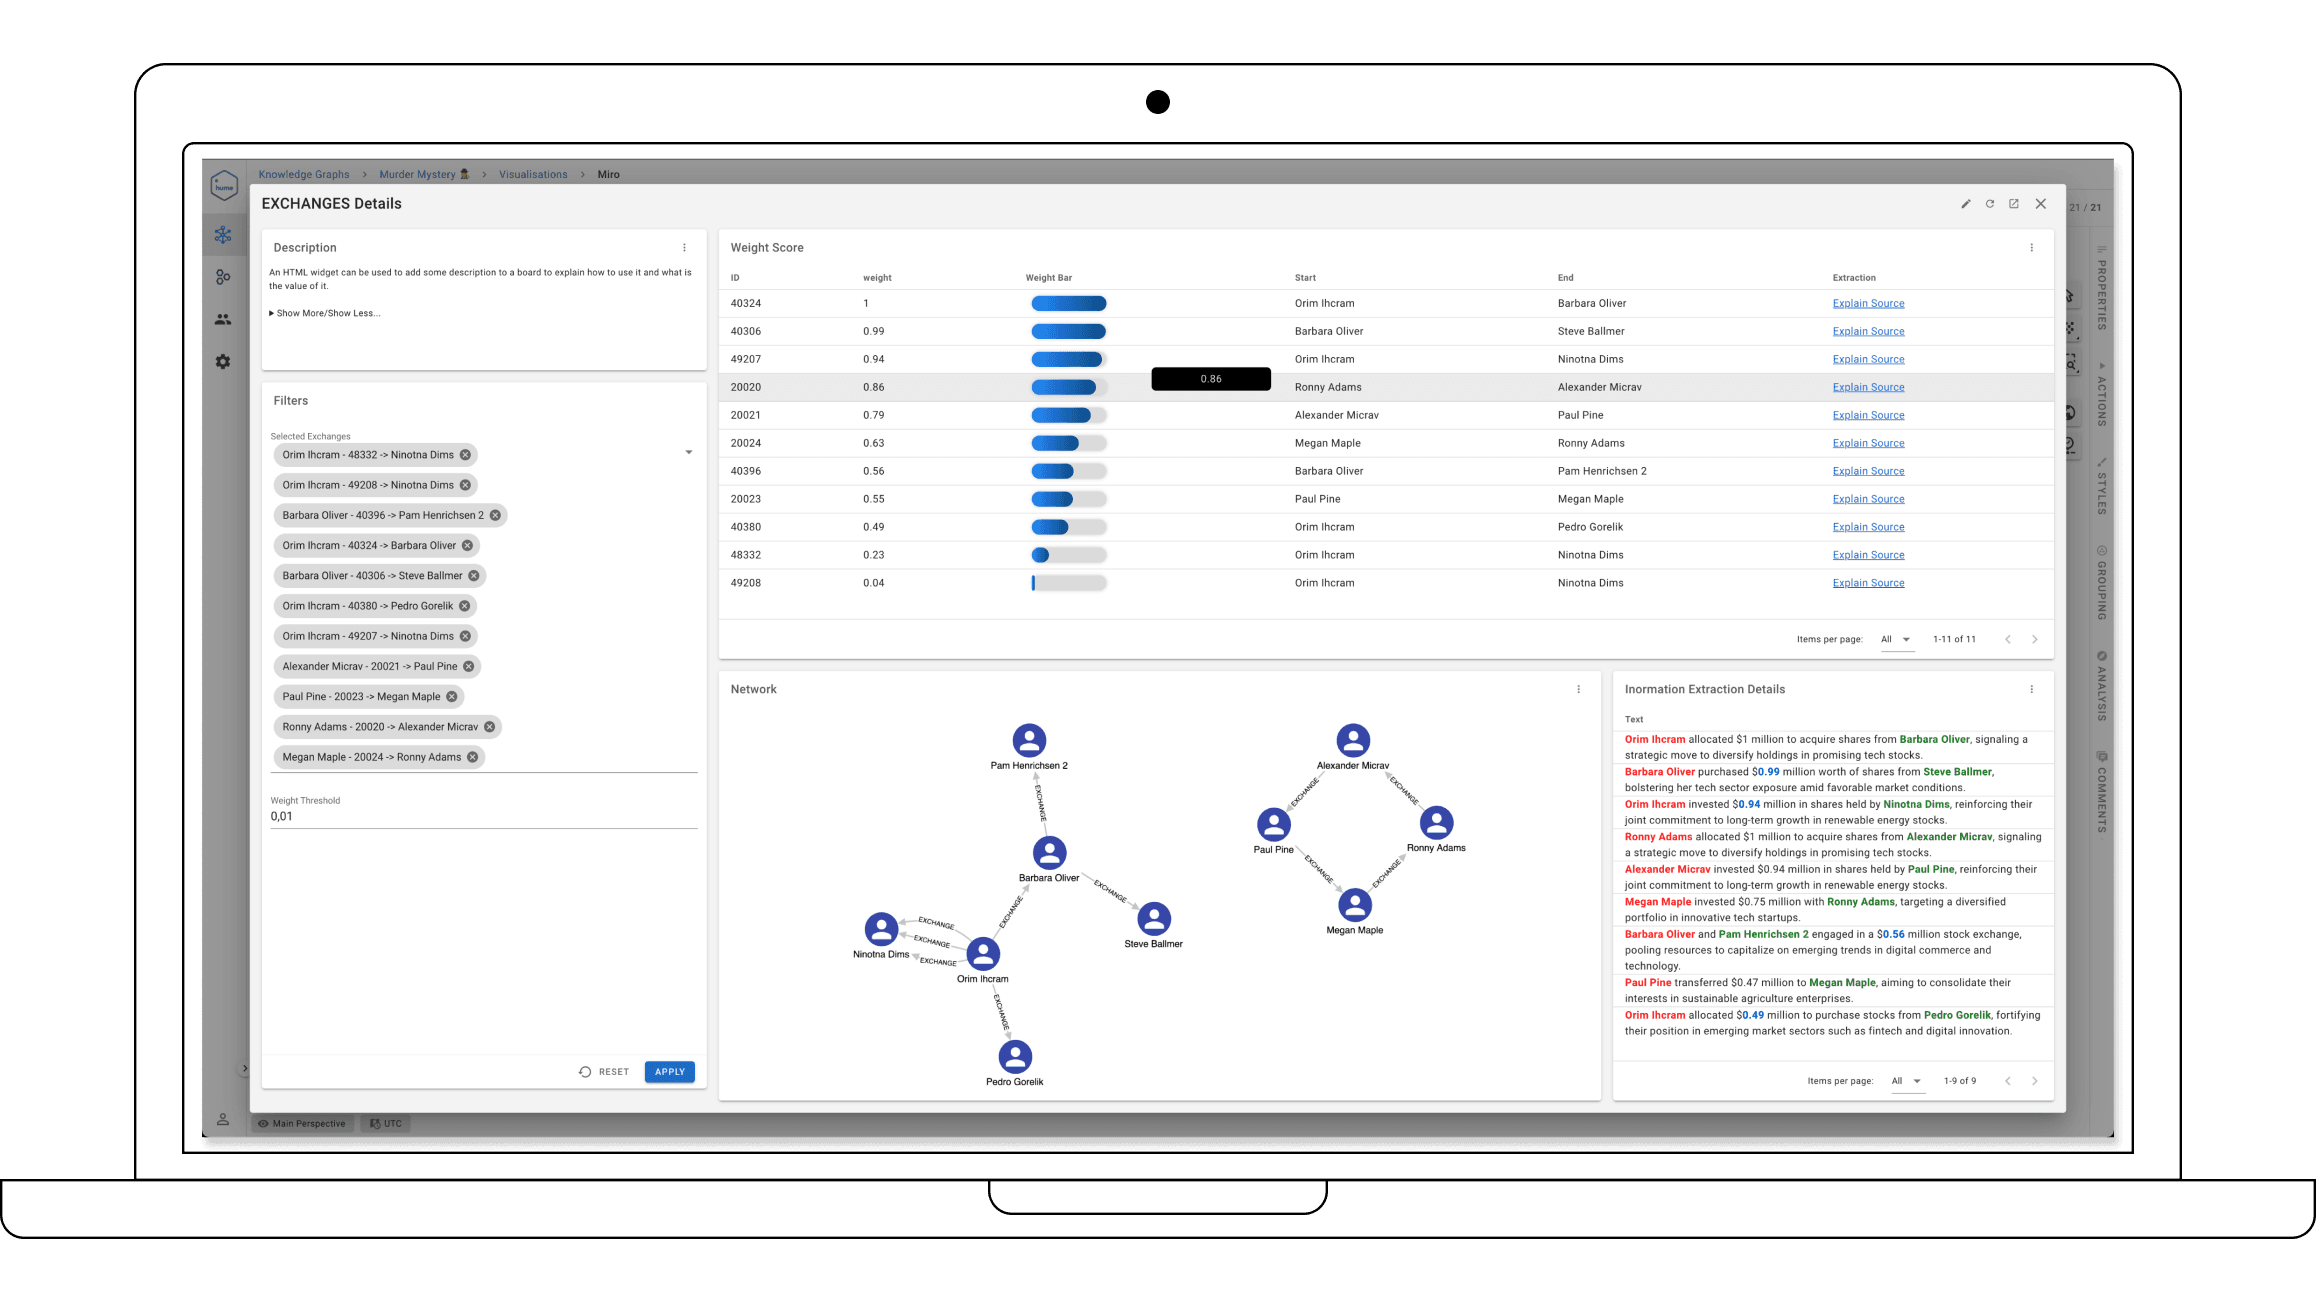
Action Boards are very important also because they offer a simple way to get an overview of a more complex thing, like a set of entities or a network, or a sub-network. You can create an Action Board representing communication patterns among some parties. It’s a Dashboard focused on a scenario or use-case, not a single entity.
How have users taken to the advanced intelligence visualisation that Action Boards offer? Have they developed use-cases that weren’t planned?
Michal Bachman: Absolutely. Advanced intelligence visualisation has redefined how GraphAware Hume is being used. People started using Action Boards for things we didn’t envision, like monitoring Hume itself. The IT department would monitor long-running queries, alerts, and knowledge graph usage.
Digital forensics teams use Action Boards to profile devices, like a phone of a suspect, showing frequent contacts, locations, pictures, and more. This kind of view is more useful at the beginning of an investigation to get an overview before diving deeper.
Miro Marchi: Another example is case management. Users created a board with a list of cases and custom fields computed by the case data. Investigators could order the table by importance, because commonly, they have too many things to do and not enough time. The first Board is an overview of all the cases with custom information. From there they can drill down to the second Board, which is a case overview with more information about the case, including charts with relevant statistics, and further details. From there, they can open a visualisation in the graph and continue to analyse the case. They can add or remove entities as needed. We don’t have a full end-to-end case management built-in, but with Action Boards, you can create an entry interface yourself.
Also, Action Boards have their own static URLs. You can land a user flow directly on the board, even from external systems. Our customers have many different systems they use. Now, they can have a URL and click a link that goes into Hume, showing the details of an entity with a board. The feedback on the integration aspect of Action Boards has been very good. Users can do stuff they couldn’t do before. Even in the Alpha version, everyone is really interested in this.
Any future plans for developing advanced intelligence visualisation?
Michal Bachman: There are two big streams of work for Action Boards. First, adding more interactivity, so when you select data in one widget, other widgets react and update. Second, creating a user-friendly way to configure dashboards, allowing anyone to visually configure their own Action Boards using drag and drop.