Everyone has a favourite grocery shop they usually go to, maybe the shop close to home, the one with the most competitive prices, the freshest fruit, or simply the best cake. Similarly, everyone may be inclined to buy from one particular e-commerce platform rather than another.
But how do the goods arrive in the stores or the storage areas of the large online shops? How is the warehouse from which the goods are supplied decided?
We can easily imagine that the shoe distribution chain is subject to fewer constraints than the food chain. Indeed, shoes have no expiry date; they do not spoil unless subjected to extreme stress, and their value is unlikely to be altered in transport. At the same time, a pair of shoes may have to travel further.
The term Supply Chain usually refers to the system of organisations, people, activities and resources involved in the processes of production, stock management and product transferring to the end customer, intermediary or retailer. The branch of the Supply Chain that plans and controls the movement of goods and services from the supplier to the customer is best known as the Logistics Chain. The Logistics objective is to ensure that the recipient receives the desired product minimising the transfer time, guaranteeing the quality of perishable products or offering the best possible service. On the other hand, the Logistics Chain is responsible for choosing the most advantageous mode of transportation and vehicles and designing the entire transport network to minimise costs and manage risks.
Logistics Chain problem
Logistics Chain is one of the most intensively studied problems in the field of combinatorial optimization, due to a wide range of applications: from the shipment of goods to end customers to the design of robust supply chains of components that span continents and are needed by large companies, upon which rely our whole economies. The potential for cost savings in this area is massive and it keeps growing every year, fueled by the rise of online businesses.
Depending on the concrete application and, thus, the constraints and assumptions involved, there exist several formulations of the problem. Research started with the Travelling Salesman Problem (TSP), which can be formulated in the following way:
“Given a list of cities and the distances between each pair of cities, what is the shortest possible route that visits each city exactly once and returns to the origin city?”
The problem has progressed along different directions [1]. One of these is known as the Vehicle Routing Problem (VRP), which tries to find the optimal set of routes for a fleet of vehicles. Variants of the latter include the Capacitated Vehicle Routing Problem where each vehicle has a limited transport capacity and Vehicle Routing Problem with Time Windows, where each destination site has a time window within which deliveries can occur.
Determining the optimal solution to TSP or VRP is an NP-hard problem. Unfortunately, this means that, based on the current knowledge, finding an optimal solution to this class of problems is not feasible, because the time required to explore all the possible solutions and find the best one is polynomial. On the other hand, this difficulty has led to the development of many different approaches, and researchers have mainly focused on defining effective heuristic-based algorithms.
The first remarkable metaheuristic is the Genetic Algorithm (GA) which is inspired by the process of biological natural selection theory [2]. Another widely used algorithm is Ant Colony Optimization (ACO) which simulates the behaviour of real ant colonies that find the shortest route to food sources by following traces of pheromone, a substance they secrete [3].
Why use graphs?
However, such problems become less complex if modelled using a graph … just think of all the algorithms that exist to solve the shortest path problem on graphs. Certainly, Logistics is much more than that because, as well as determining minimum routes, an essential point is to identify the optimal aggregation of destination sites and the best combinations of sites and vehicles.
For this purpose, a reasonably straightforward approach involves a clustering algorithm to group target sites according to their geographical location [4]. The aggregation of nearby sites aims to assign a vehicle to each geographical area, in this way minimising the costs. This means that if we are arranging a shipment from Paris to Orange (a town in the south of France more than 700 km from Paris), and know that another order has been placed for the coming days for Montélimar, which is 55 km from Orange, it is probably convenient to use the same vehicle to visit both places, thus avoid another vehicle going to Montélimar on another day.
After calculating the Euclidean distances between the target sites and storing them as relationships among nodes, we find the groups of cities using the community detection Label Propagation Algorithm (LPA) from the Neo4j GDS library. This algorithm initialises each node with a unique label (cluster ID) and, through an iterative process of label propagation, achieves that the more strongly connected nodes are grouped under a common label. Since we need multiple steps to execute the entire process, it is convenient to define a dedicated workflow for this task.

The above workflow is composed using Hume Orchestra, where the second component from the left involves invoking the following Cypher query:
MATCH (site:Site)

WITH {item:id(site), weights: [coalesce(site.geo.latitude, gds.util.NaN()), coalesce(site.geo.longitude, gds.util.NaN())]} AS site_data

WITH collect(site_data) AS data

CALL gds.alpha.similarity.euclidean.stream(

{ data: data, similarityCutoff: 1.4 })

YIELD item1, item2, similarity

WHERE gds.util.isFinite(similarity)

WITH gds.util.asNode(item1) AS from, gds.util.asNode(item2) AS to, similarity

MERGE (from)-[:NEAR_TO {distance:similarity}]-(to)
Essentially, we create a NEAR_TO relationship between each pair of sites with a distance (with respect to geographical coordinates) of at most 1.4 degrees, where this parameter was chosen empirically. We then apply the Label Propagation algorithm on top of the newly created mono-partite subgraph (site)-[:NEAR_TO]->(anotherSite), considering the distance attribute as a weight.
Once the clusters of sites have been obtained, it is possible to reason on top of them using different approaches. The first approach is to organise deliveries according to the priority of orders. This ensures delivery of the most urgent orders and, in the event that it is not possible to deliver all goods, only those with a longer delivery time are delayed. This is stated in the following query; it takes as input the source_id of the storehouse from which orders with destination in cluster_id are selected, based on their priority (time_window_end) and the weight capacity of the vehicle_id.
MATCH (source:Depot {id:$source_id})<-[:HAS_SOURCE]-(o:Order)-[:HAS_DESTINATION]->(site:Site), (vehicle:Vehicle {id:$vehicle_id})

WHERE NOT o:Delivered AND site.lp_closeness = $cluster_id

WITH vehicle, o, apoc.date.parse(o.time_window_end, "ms", "dd.MM.yyyy") as end_time

ORDER BY end_time

WITH vehicle, collect(o) as orders

//calculate the total weight of the load every time an order is added

WITH vehicle, orders,

[j in range(0, size(orders)-1) | REDUCE(weight= 0, i in range(0, j) | weight + orders[i].weight )] as weights_list

//stop adding goods when the maximum weight is reached

WITH vehicle, orders, weights_list,

[j in range(0, size(orders)-1) WHERE weights_list[j]<= vehicle.capacity |orders[j] ] as eligibleGoods

RETURN eligibleGoods
Similarly, an order of site visits can be defined according to their time window of availability, if such a constraint exists, or simply by using a Shortest Path algorithm to find the minimum route from the warehouse through all sites.
Why use Hume?
Regardless of the constraints involved in the problem and the algorithm chosen, advantages in the Logistics Chain problem can be provided by Hume, GraphAware’s Graph Analytics Solution. Hume’s strengths are the speed in defining complex workflows with various chained logic or algorithms to solve problems, the simplicity in verifying and comparing the results produced, and above all, the immediacy in understanding what is going on thanks to the powerful visualisation modes.
We have experienced before that we can use an Orchestra workflow to calculate clusters of sites; similarly, any more complex or accurate algorithm can be implemented in a user-friendly way with Orchestra. But don’t forget that even simple Actions can enhance our Visualisation, helping us get a clearer representation of the situation. Actions are user-defined Cypher queries executable by a click in the UI and designed to curate the visualisation to a specific domain and use case.
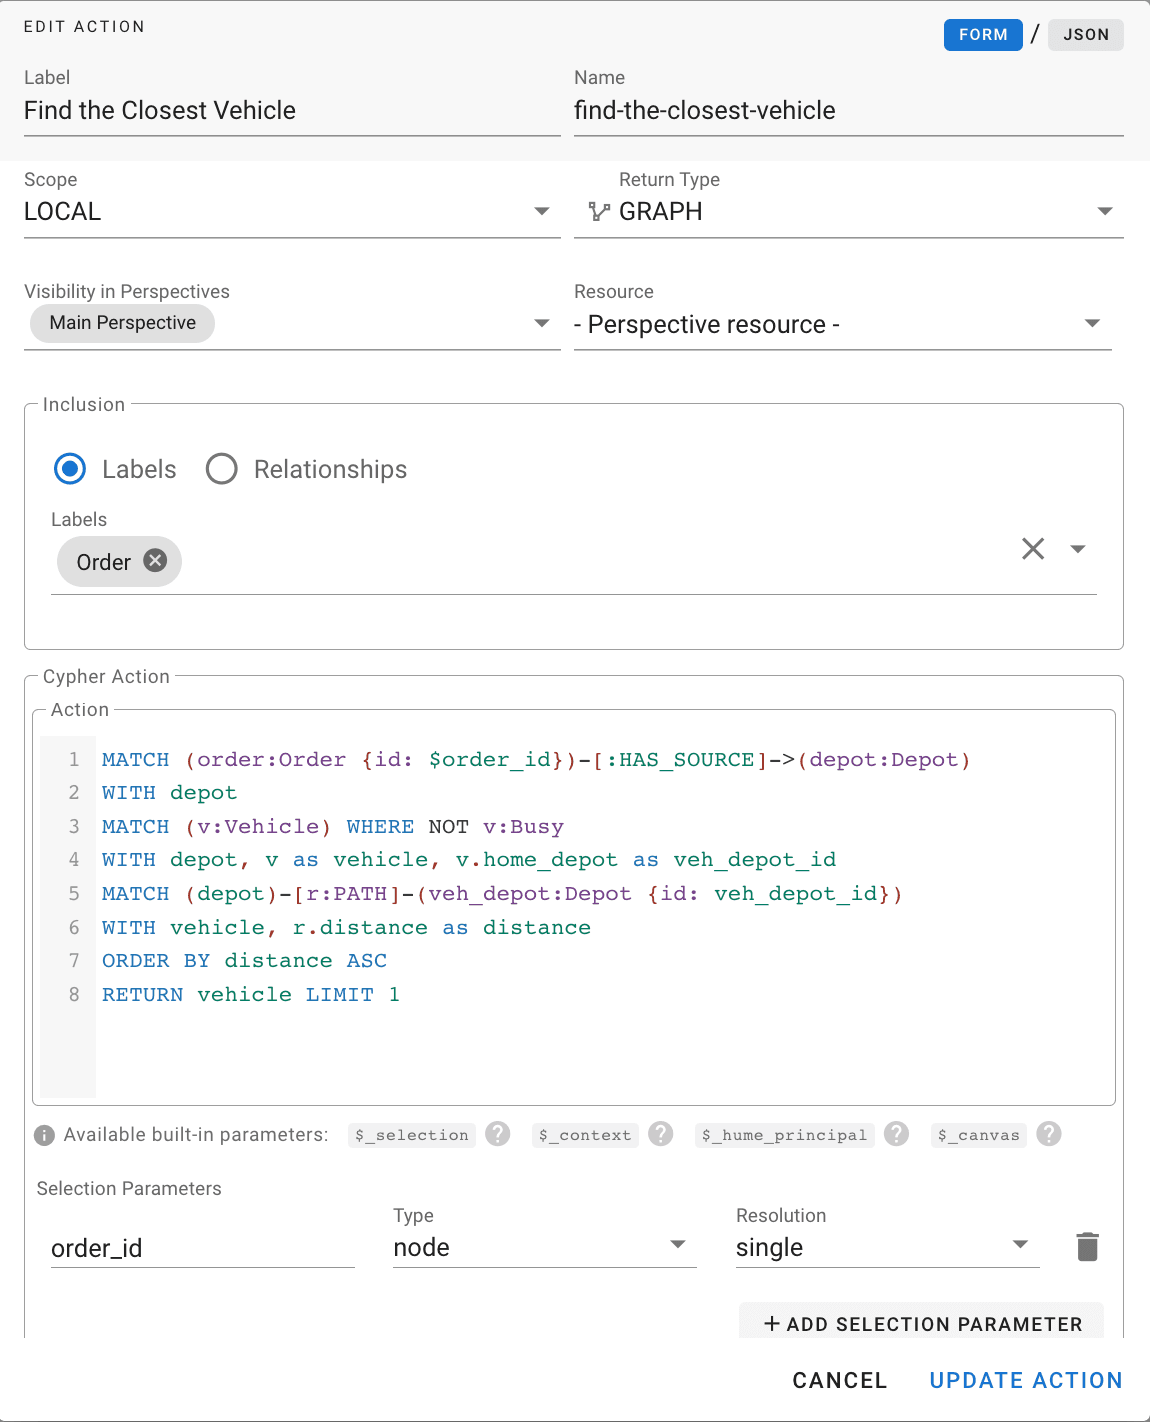
Suppose we don’t need to launch the algorithm to calculate the solution but only send a single order, perhaps because, through a previous analysis we realised that only one order has to be dispatched the next day. In such situations, an action like the following one would be appropriate.

The above local Action executes the provided query on a selected Order node and retrieves the unoccupied vehicle closest to the order’s warehouse.
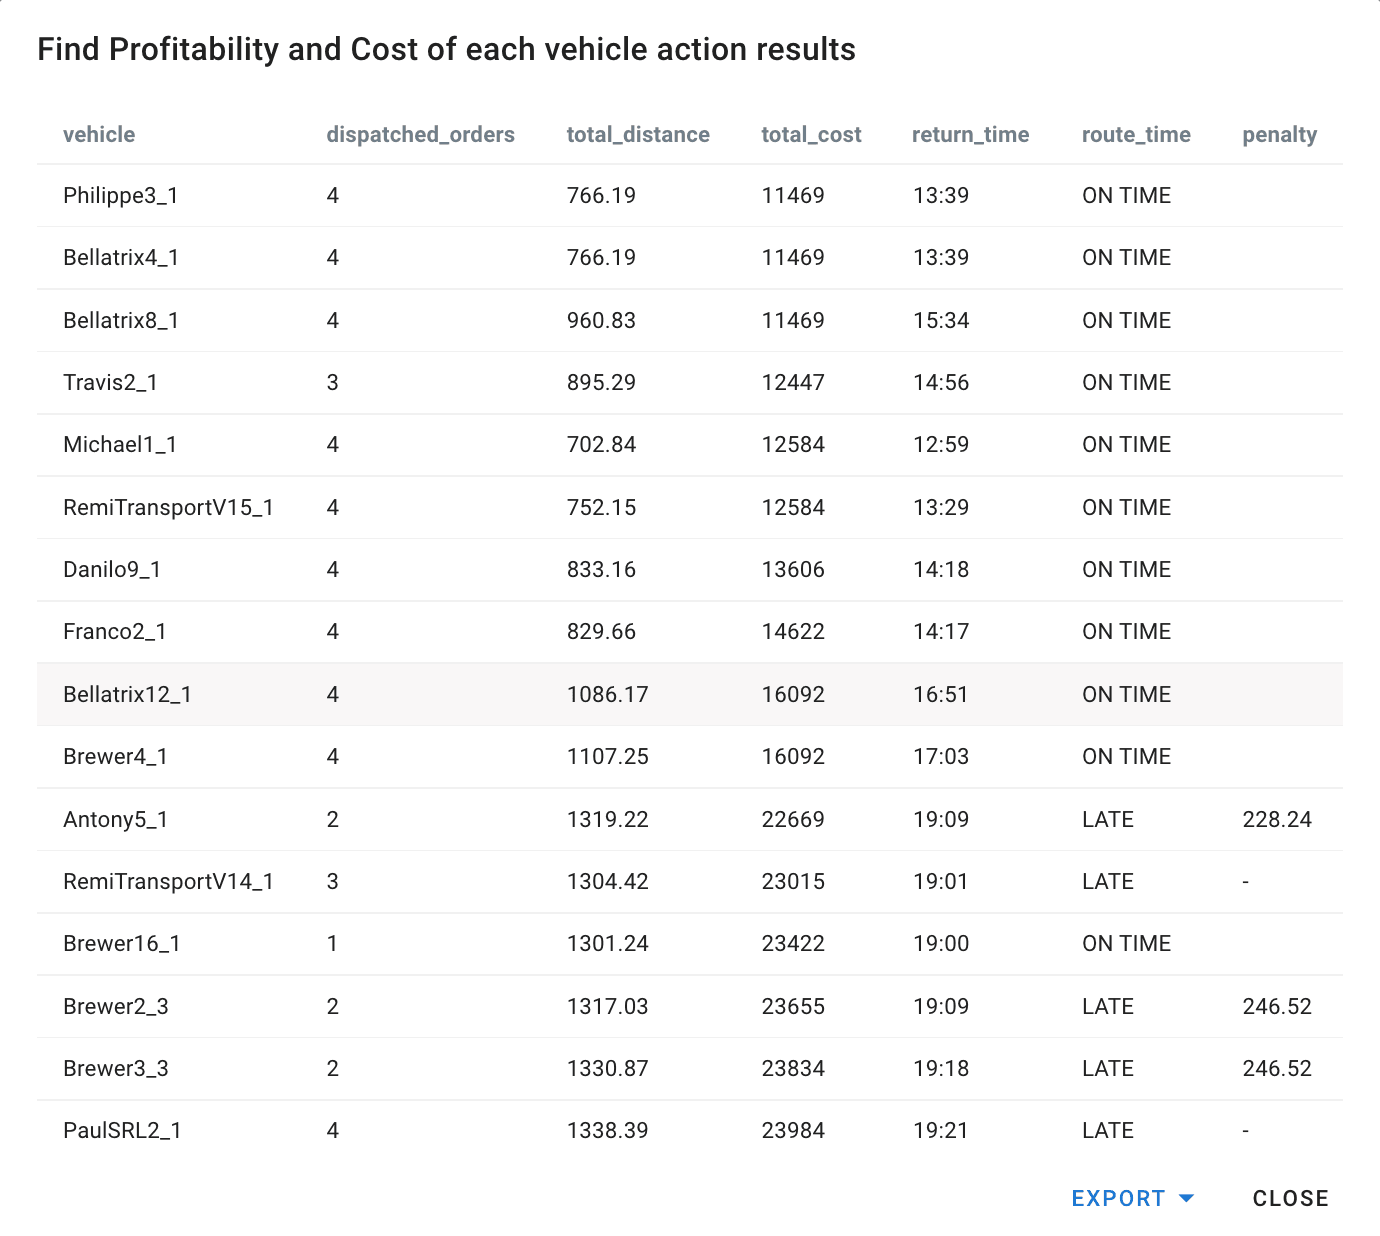
However, an action can also help evaluate and compare the results of multiple simulations. In this case, it is sufficient to define an appropriate cost function (metric) and write a Cypher query to assess it. In the figure below, we can see the result of an action, which identifies the most expensive routes in tabular form. Here the metrics used are the return_time, which is when the vehicle is estimated to return to home depot (because we have assumed a penalty in case the closing time is violated), and the total_cost function which represents the time the vehicle travels empty without goods. We also have information about the number of dispatched orders and the total distance travelled.

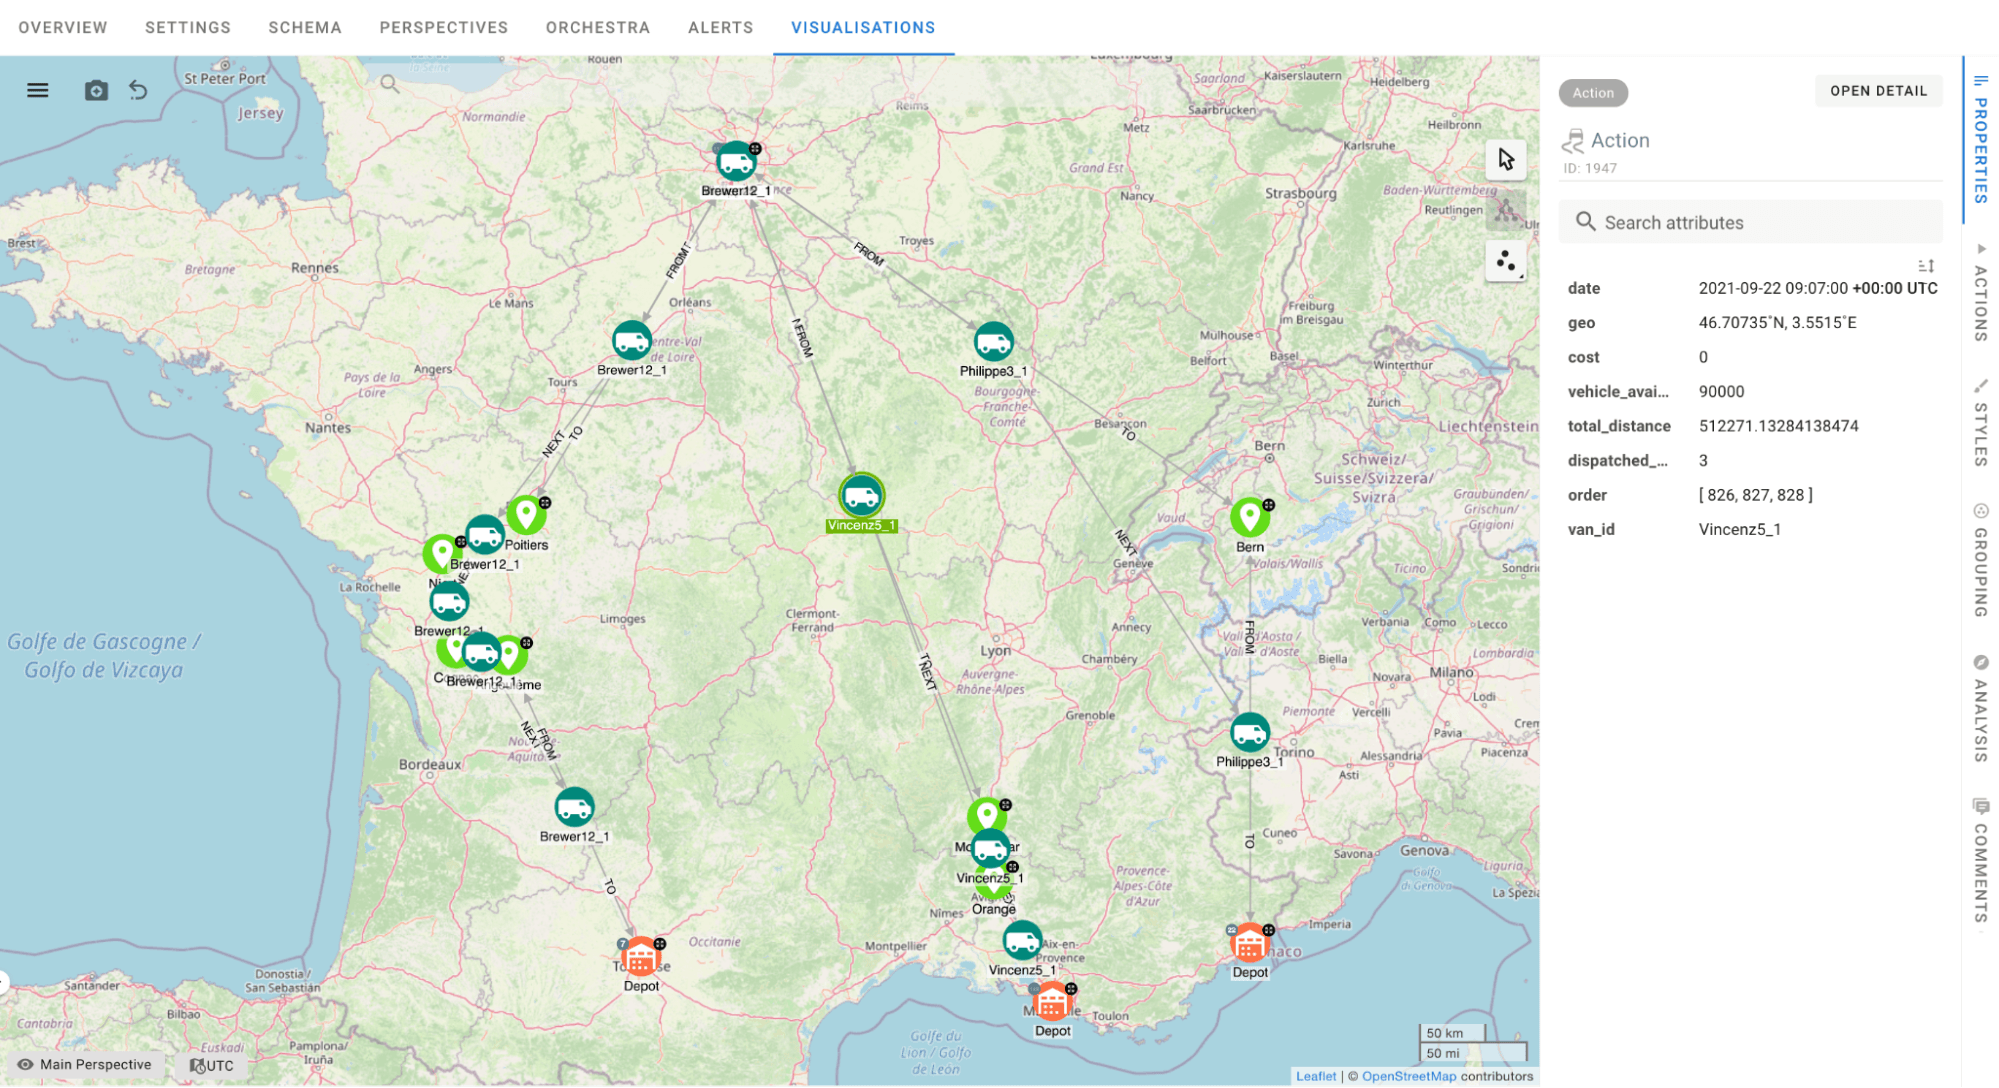
As for the visualisation tools, Hume offers both Spatial and Temporal analysis. Spatial analysis allows us to display nodes with geographical features on a map, while at the same time giving us access to the nodes’ attributes. This means that by selecting a certain number of vehicles associated with a route, we can see the sequence of cities and, therefore, the routes they are going to visit.

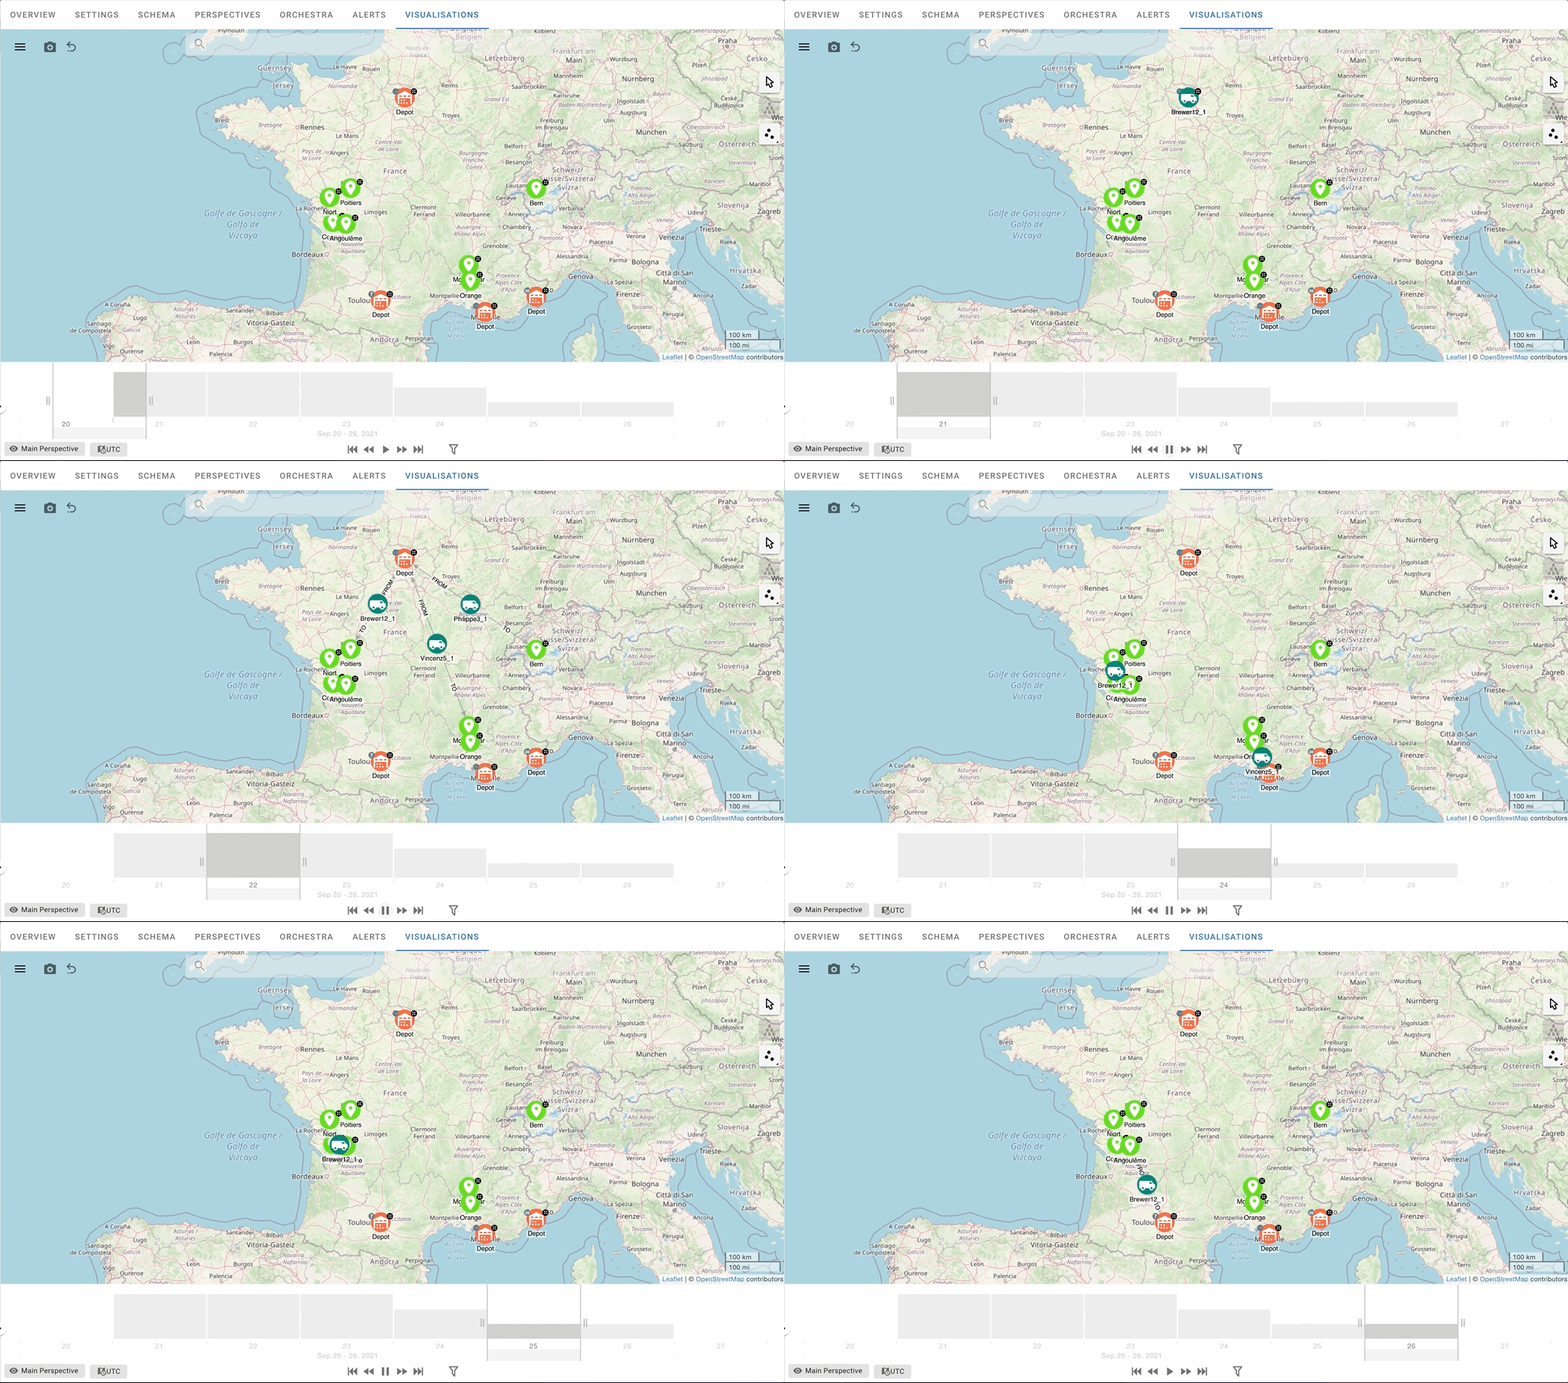
On the other hand, temporal analysis allows us to visualise the sequence of destination nodes associated with a route over time. This temporal perspective makes the problem more intuitive … let’s not forget that it is essential to plan the activities in advance and that the temporal aspect plays an essential role in the quality of the solution obtained.
When we combine temporal and spatial visualisation, we get a clear representation that leaves no room for interpretation. In this way, not only can we visualise each vehicle’s routes, but we can also monitor the vehicles as they move through time.

Conclusion
Logistics plays a fundamental role in commerce, in manufacturing and many others. It is gaining even more relevance as the economy becomes social and “on demand”. However, vehicle routing is a very complex problem; it is an active and moving field of research to which new challenges are added every day, such as making the process more sustainable or realising what is called the Green Supply Chain.
The algorithm we have outlined is a starting point, a sort of baseline that can be defined using Cypher and graph algorithms. Our aim was not to find a solution competing with the research of various top universities and companies trying to solve this NP-hard problem for several decades already but to showcase how graphs can make this task more explainable, interactive and manageable by humans. The advanced algorithms curated for the logistics optimization problem can be integrated in this graph-based approach using Hume Orchestra, an advanced graph workflow engine tool, and visualised and analysed using customised Hume Visualisation.
Bibliography
[1] Choong Y. Liong, Ismail Wan Rosmanira, Omar Khairuddin, and Mourad Zirour, “Vehicle routing problem: models and solutions”, Journal of Quality Measurement and Analysis, 2008, 205-218.
[2] Przemysław Ignaciuk, and Łukasz Wieczorek, “Continuous Genetic Algorithms in the Optimization of Logistic Networks: Applicability Assessment and Tuning”, Applied Sciences, 2020, 10(21):7851.
[3] Phan N. Ky Phuc, and Nguyen L. Phuong Thao, “Ant Colony Optimization for Multiple Pickup and Multiple Delivery Vehicle Routing Problem with Time Window and Heterogeneous Fleets”, Logistics, 2021, 5(2):28.
[4] Kamil Bujel, Feiko Lai, Michal Szczecinski, Winnie So, and Miguel Fernandez, “Solving High Volume Capacitated Vehicle Routing Problem with Time Windows using Recursive-DBSCAN clustering algorithm”, arXiv:1812.02300v2, 2019.

