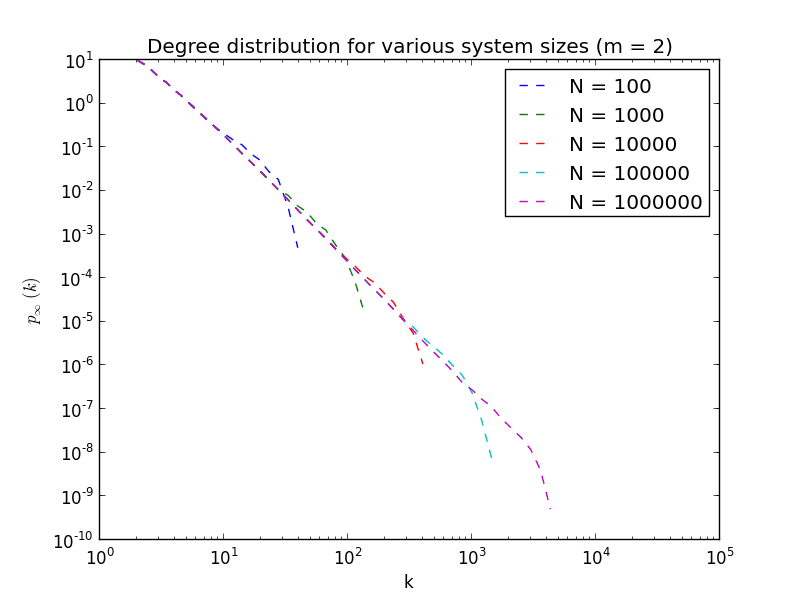
When one obtains a graph data from a measurement on a real world network, it is sometimes useful to make comparison with a random graph. Such graph is characterised by certain degree distribution, which you can imagine to be a list of degrees of nodes present in the network. The most interesting distributions have certain functional dependence which allows one to infer what processes are dominant in formation of the network. The processes consequently characterise the relationships between the nodes.
Why would one care about such analysis?
Imagine a group of customers that you want to target efficiently in a certain fashion. Say, for instance, that you want to optimise the way information is propagated between people in the network. Which one of our customers do we give a freebie, so that she convinces her social contacts to become customers, too? We might also be interested, on the other hand, how to stop information from propagating. Which terrorist do we get rid of first in order to cause the greatest possible network disruption?
Different Types of Networks
Different networks can have very different characteristics. Contrast, for example, a graph modelling an organised group of people who work in a corporate firm to a group of people moshing randomly at a punk-rock gig. At the point where the corporate network shows (say) a structure dominated by important people (the bosses are the ones to aim at when you want to make an impact), the moshpit network is mainly dominated by local interactions (local, as it is hard to prod someone at the end of the room in a pogo madness) and so it would be better to target the punkers evenly.
The main point of graphs (and graph databases) of course is not to model propagation of punches in punk-rock moshpits. The important fact to draw here though is that there exist social (and abstracting even more – physical) processes, which are governed by local interactions between the nodes (people). Characteristics of the local interactions then influence the overall behaviour of the network and vice-versa.
The two most basic kinds of theoretical random network models we are going to mention in this article are the so-called graph-theoretic random networks (or Erdos-Renyi graphs) and preferential attachment networks (for example Barabasi-Albert graphs).
Erdos-Renyi Graphs
Erdos-Renyi graphs are formed by completely random interactions between the nodes. Each node chooses its neighbours at random, constrained either by an overall number of relationships that might be assigned in the graph, or a probability of connecting to a certain neighbour. This gives rise to a degree distribution which decays with exponential character. There are statistically no big brothers with connections to (formally) everyone.
Barabasi-Albert Model
In contrast, the Barabasi-Albert model pinpoints the so-called preferential attachment. Each node (person) chooses a new friendship on the basis of importance of a potential friend. In this case, the importance is only proportional to the number of friends a potential contact already has. You can imagine it as going to a party attended by a few people who have a lot of contacts. As a newcomer, you may be convinced that it is advantageous to talk to such people as they are going to enlarge your contact network quicker. Hence you give a preference to these people. Such interaction gives rise to a so called fat-tailed distribution, where there is (in an infinite network) no characteristic number of contacts on the network.

From Theory to Practice
The situation is not always as ideal in practice. However, there still is a striking resemblance of the model’s character to some real world systems. Consider the internet, for example, (for which the last model was originally proposed in fact)
- there is only one big G and F, followed by a unique big Y, binged by big B., and a few other players. In contrast, there are many more people who still run personal blogs, not being linked to by almost anyone. The point is that there are hubs – the ultrafamous, whose influence is the largest. No surprise – in a global sandbox, it would be most important to target these effectively.
What is perhaps more fruitful is the fact that you could potentially optimise your aims by targeting the part of distribution which is slightly less important, but perhaps with lower barriers of entry. In turn, this might allow you to obtain a greater overall influence on the network as a result.
Random Graphs in Neo4j
For graph database users, random graph models can be very useful as well, especially for functional and performance testing of code and queries against a data set that resembles real-world data. For this reason, we are working hard at GraphAware to implement a number of random graph generators into the GraphAware Framework.
In the next blog post in this miniseries, we will look at other models, such as the Watts-Strogatz model. Shortly after, we will release the implementations of a number of different random graph generators and publish another, practical post about that. Stay tuned!
About the Author
Vojtěch Havlíček is an MSci student in Theoretical Physics at Imperial College London and an intern and graph theory consultant at GraphAware.
References
- Emergence of Scaling in Random Networks, A.L. Barabasi and R. Albert, SCIENCE, vol. 286 15, Oct 1999
- Networks: An Introduction, M. Newman, Oxford University Press, 2010
