Dependencies, like graphs, are everywhere. Achieving a goal is rarely possible in a vacuum and requires collaboration between individuals and/or processes. Eliminating dependencies completely is unrealistic- they are a part of life- but they can be streamlined to improve efficiency and reduce friction.
In this blog post, we use the example of software projects, but dependency management can very well be applied to many verticals, such as supply chains, business processes, inventory management and government processes and workflow.
Quite a few organisations struggle as the time draws close to releasing or delivering a version of their software projects. For many, it is a time of chaos, firefighting and frustration. Unblocking dependencies benefits any organisation that performs work concurrently. Dependencies are connected, and modelling them as a graph surfaces those connections quickly, enabling decisions to be taken that promote zero waste and more efficient delivery.
Lean principles and waste in software projects
Derived from the Japanese manufacturing industry, lean principles focus on systematic waste minimisation, without sacrificing productivity. It takes into account the waste created by overburden and unevenness in workloads. The elimination of waste can improve quality while reducing production time and cost. Commonly referred to as the 3 M’s, Muda, Mura and Muri categorise types of manufacturing waste. Examples of these are activities or processes that do not add value or overproduction/defects (muda); the failure to smooth, which puts unfair demands on processes and people (mura); and indirect costs and overburden (muri). In IT, these wastes can be translated to
- Defects- An example is cowboy-style coding or random application changes, which produce a business outcome of poor service and increased costs
- Overproduction- The unnecessary delivery of low-value features can lead to business and IT misalignment and increased maintenance costs
- Motion (excess)- Repetitive firefighting, leading to a loss of productivity and an increase in the amount of cost and energy expended
- People- Spending time on mundane tasks instead of innovating and producing quality work eventually causes low engagement and the loss of talent
Lean philosophy regards everything as not adding value to the customer, as waste.
For software engineering, industry research has indicated that the most common causes of waste are attributed to
- Building the wrong feature
- Backlog mismanagement
- Rework
- Unnecessarily complex solutions
- Waiting/multitasking
- Rapid switching of people between tasks
- Process overhead and management activities
Tabular views
Scrum, an agile method, has it roots in lean thinking. An understanding of dependencies is important in larger formats such as scrum of scrums or long-term software delivery projects. Despite this, the view that project managers are often faced with is tabular, as seen in a screenshot from JIRA below.

A list-based approach does not expose underlying connections between tasks. The time taken to produce dependency chains out of tabular tasks does not encourage just-in-time decision-taking, and moreover, frequent changes on the ground render previous decisions invalid, thus causing waste by re-planning and re-predicting.
Model dependencies as a graph
This improves almost instantly when the view switches from a table to a graph. In the image below, a long dependency chain is clearly visible.

This graph is a view from the Neo4j browser and shows how entities are interconnected via relationships. We simply exported JIRA issues into CSV and loaded them into Neo4j as Tasks. The graph can be queried with Cypher, a declarative query language, and the results can be visualised for link analysis or dependency inspection. The graph we see here was produced very simply, in fact, it has just one label and one relationship type. Nodes are given a label Task, and Tasks are related to other Tasks via the DEPENDS_ON relationship.

As more and more tasks are represented in the graph, it quickly grows, and dependencies are clearly visible.
Let’s have a look at dependency chains with at least one task open. MATCH path=(:Task)-[:DEPENDS_ON]->() WHERE ANY (n IN nodes(path) WHERE n.status IN ["Open","In Progress"]) RETURN path

We see 5 candidates to begin working on. Which one should we pick? Usually, one tends to think the longest chain is most important and picks that first. This Cypher query will show us the longest chains:
MATCH path=(t:Task)-[:DEPENDS_ON*0..]->()
WHERE ANY (n IN nodes(path) WHERE n.status IN ["Open","In Progress"])
RETURN EXTRACT (t IN nodes(path) | t.name) AS tasks, length(path) as pathLength ORDER BY pathlength DESC

Perhaps we should focus our effort on one of the chains with length 4?
The length or complexity of the chain has no strong correlation with business value
We must capture this business value to be able to decide what to prioritise. This can be achieved very simply with a numeric property value on each Task node.

Let’s now have a look at the sum of the business value instead of the length of the path:

In fact, a path of length 3 produces the highest business value when complete, and this is where efforts should be focused. This addresses Muda- the waste incurred by activities that do not add value.
Evaluate impact
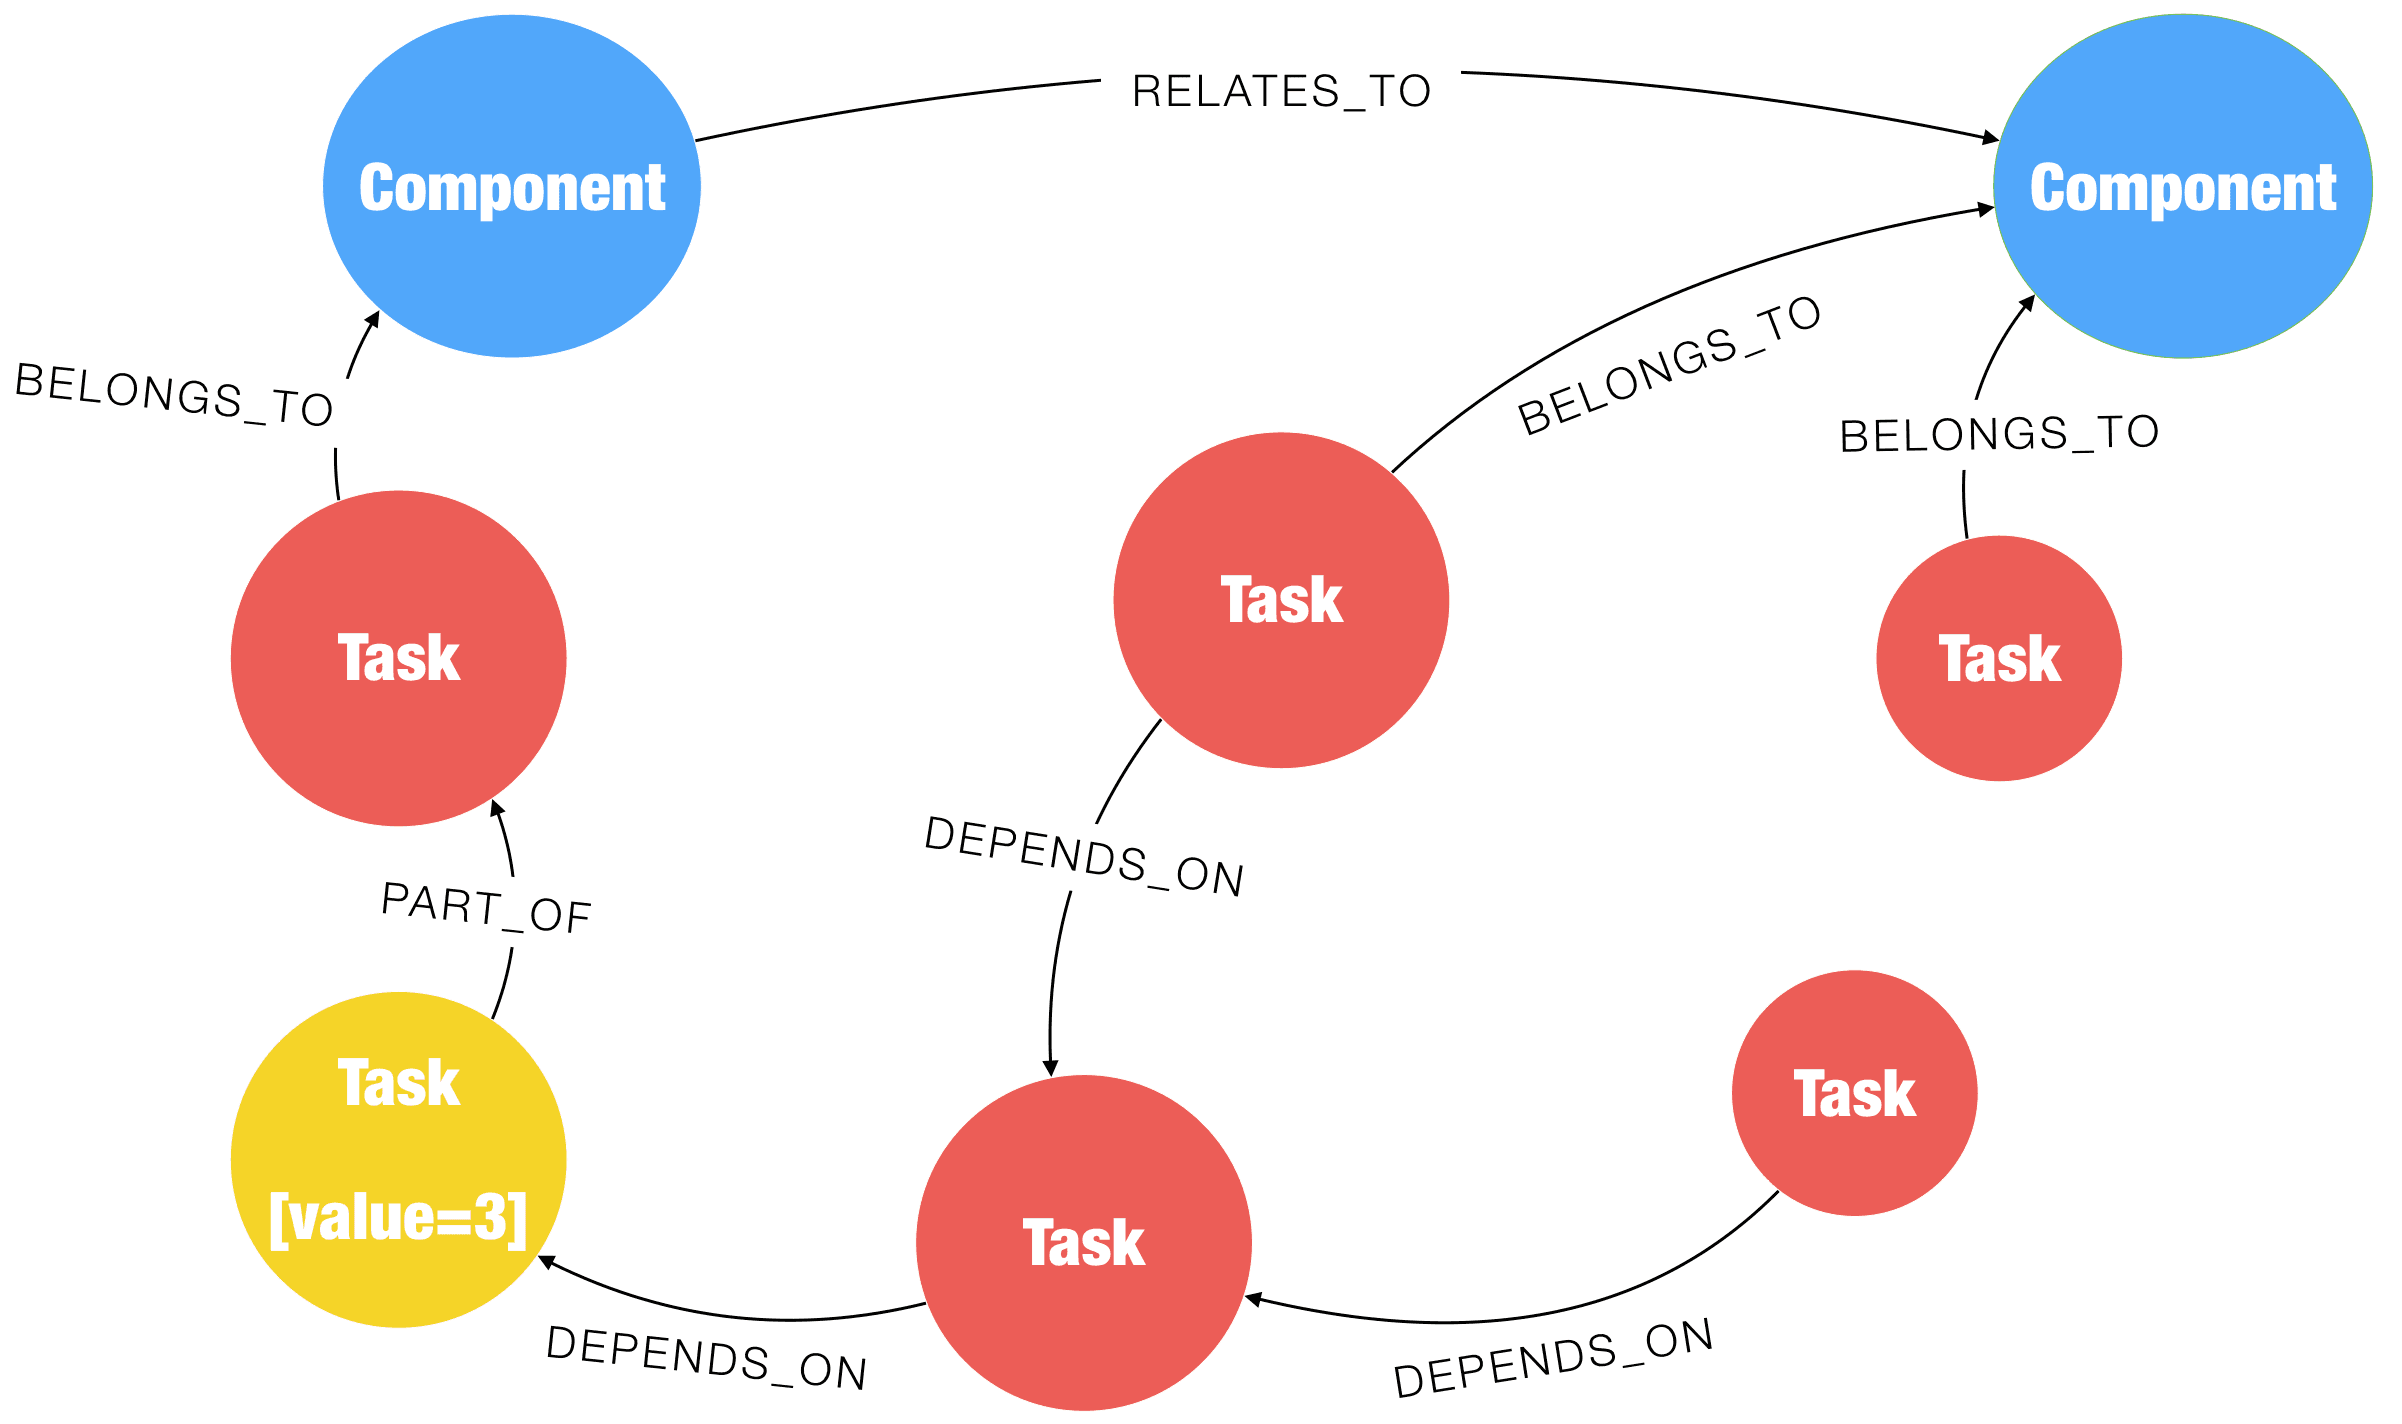
Let us extend the model to include Components. Tasks BELONG_TO Components, and Components RELATE_TO other Components. One very simple example is to see what the impact could be if a change were introduced very late in the cycle. Here, we see that a change is coming that heavily impacts the yellow Task node.
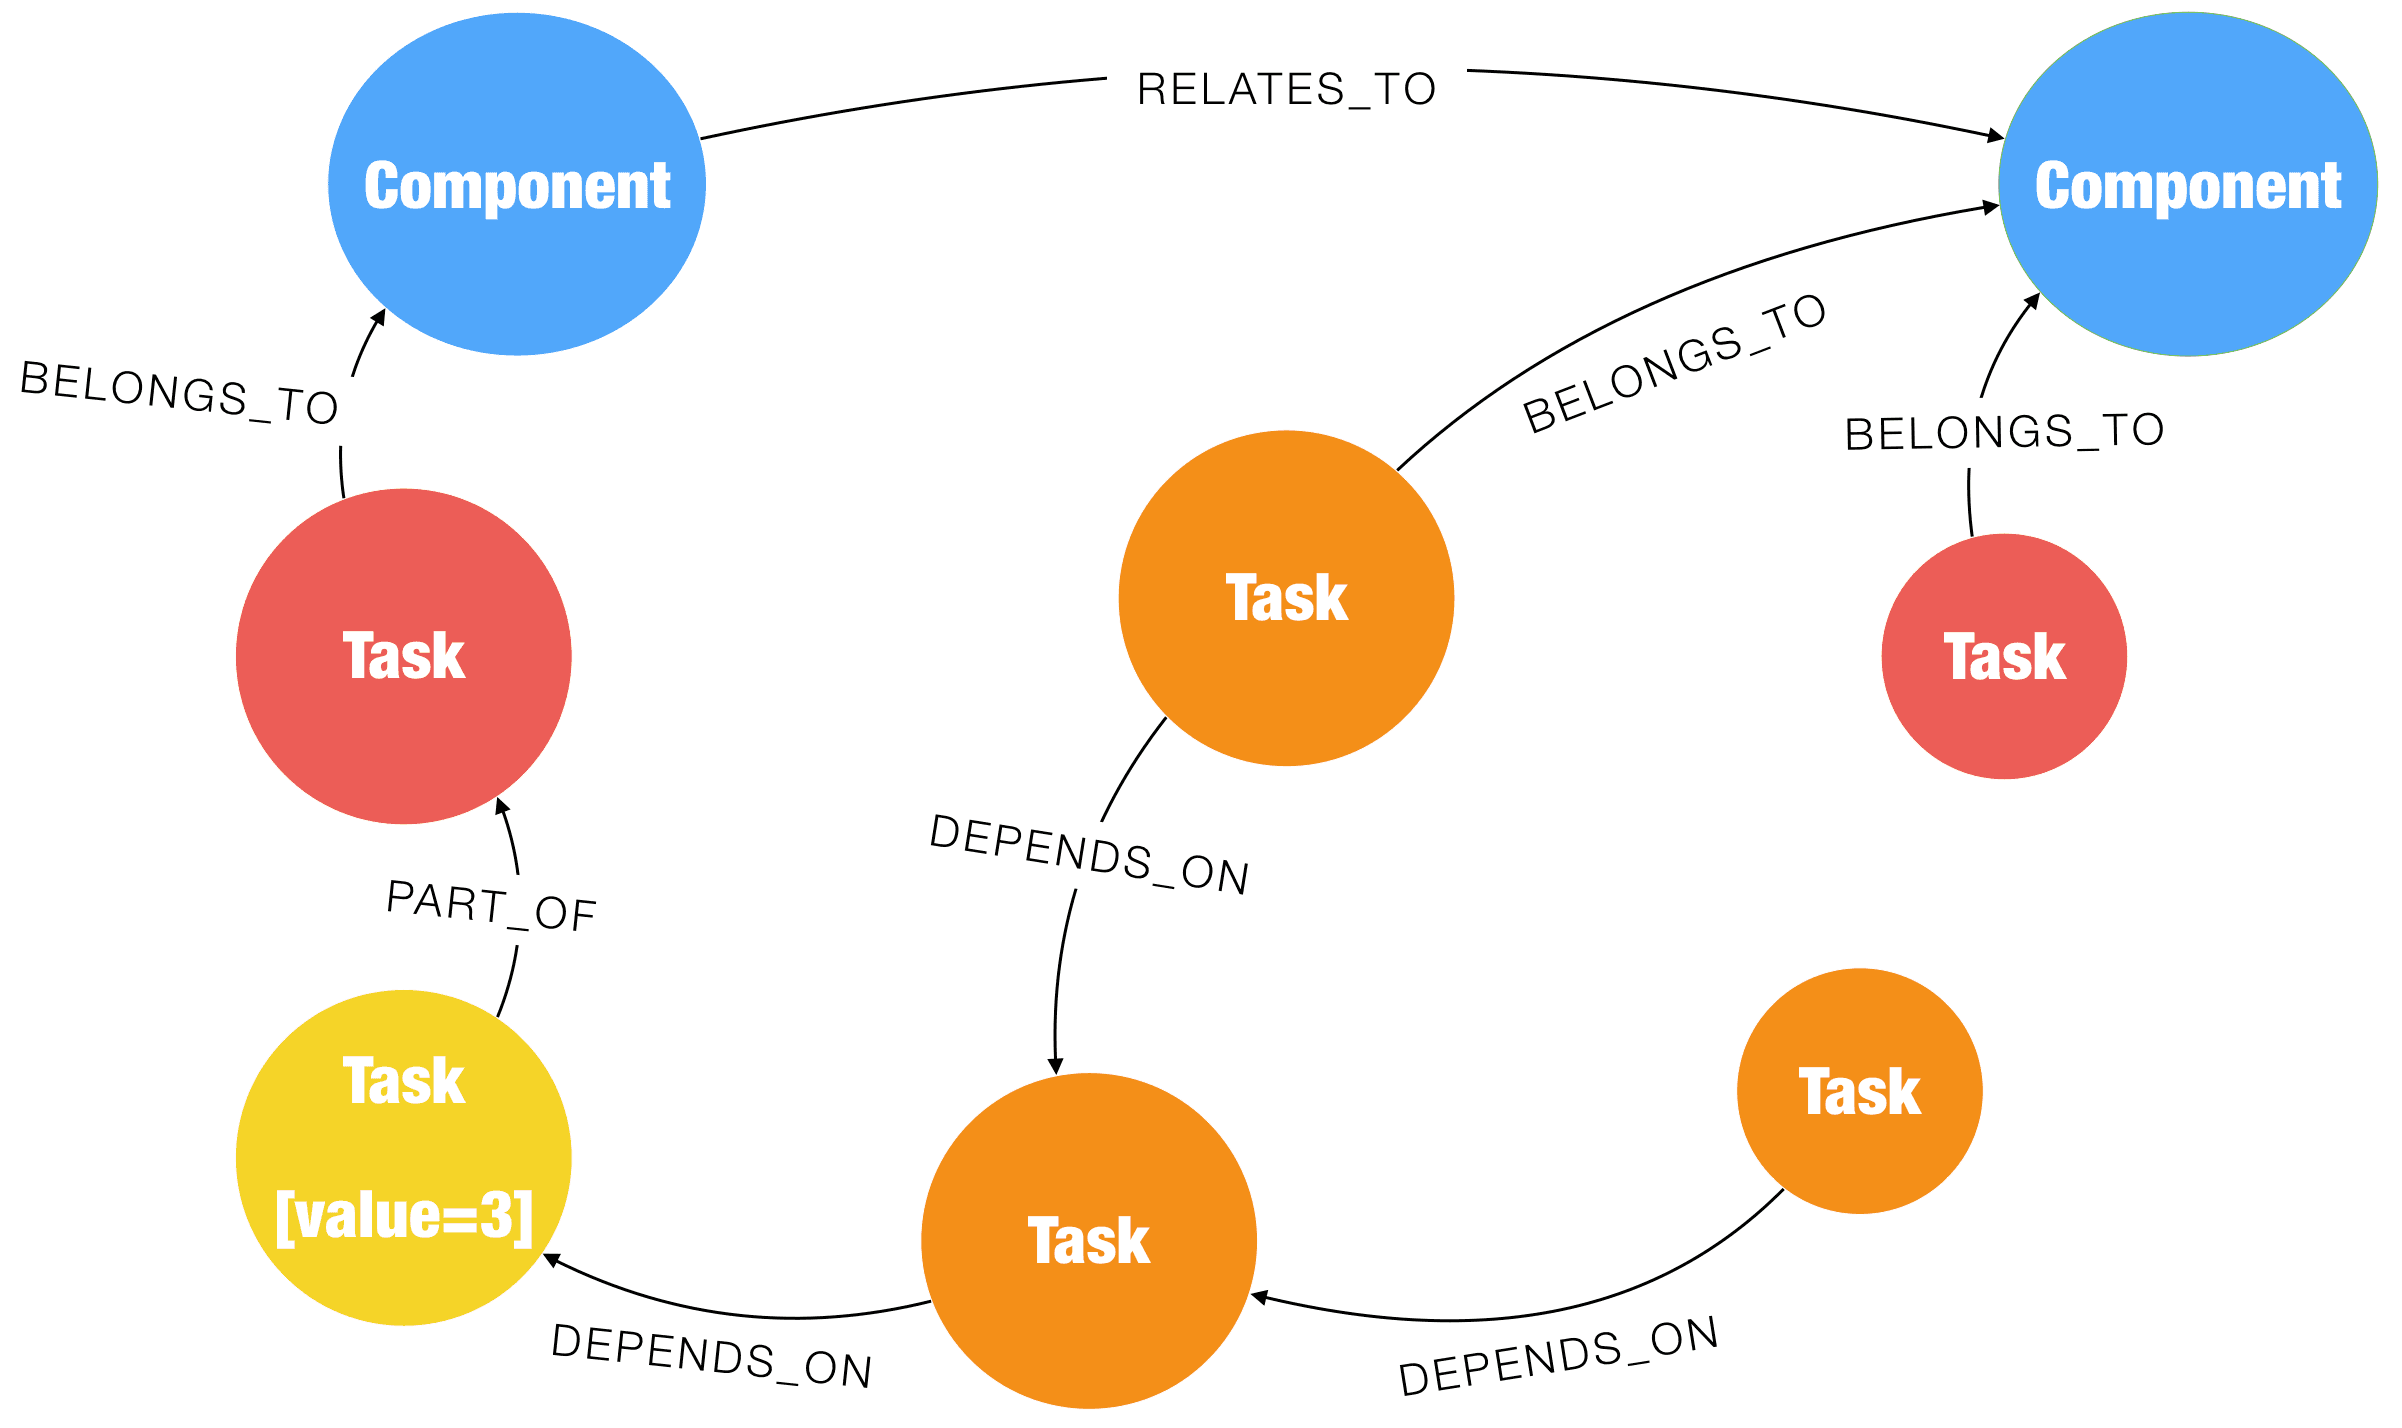
First, all tasks that depend upon that task are impacted. These are represented in orange.
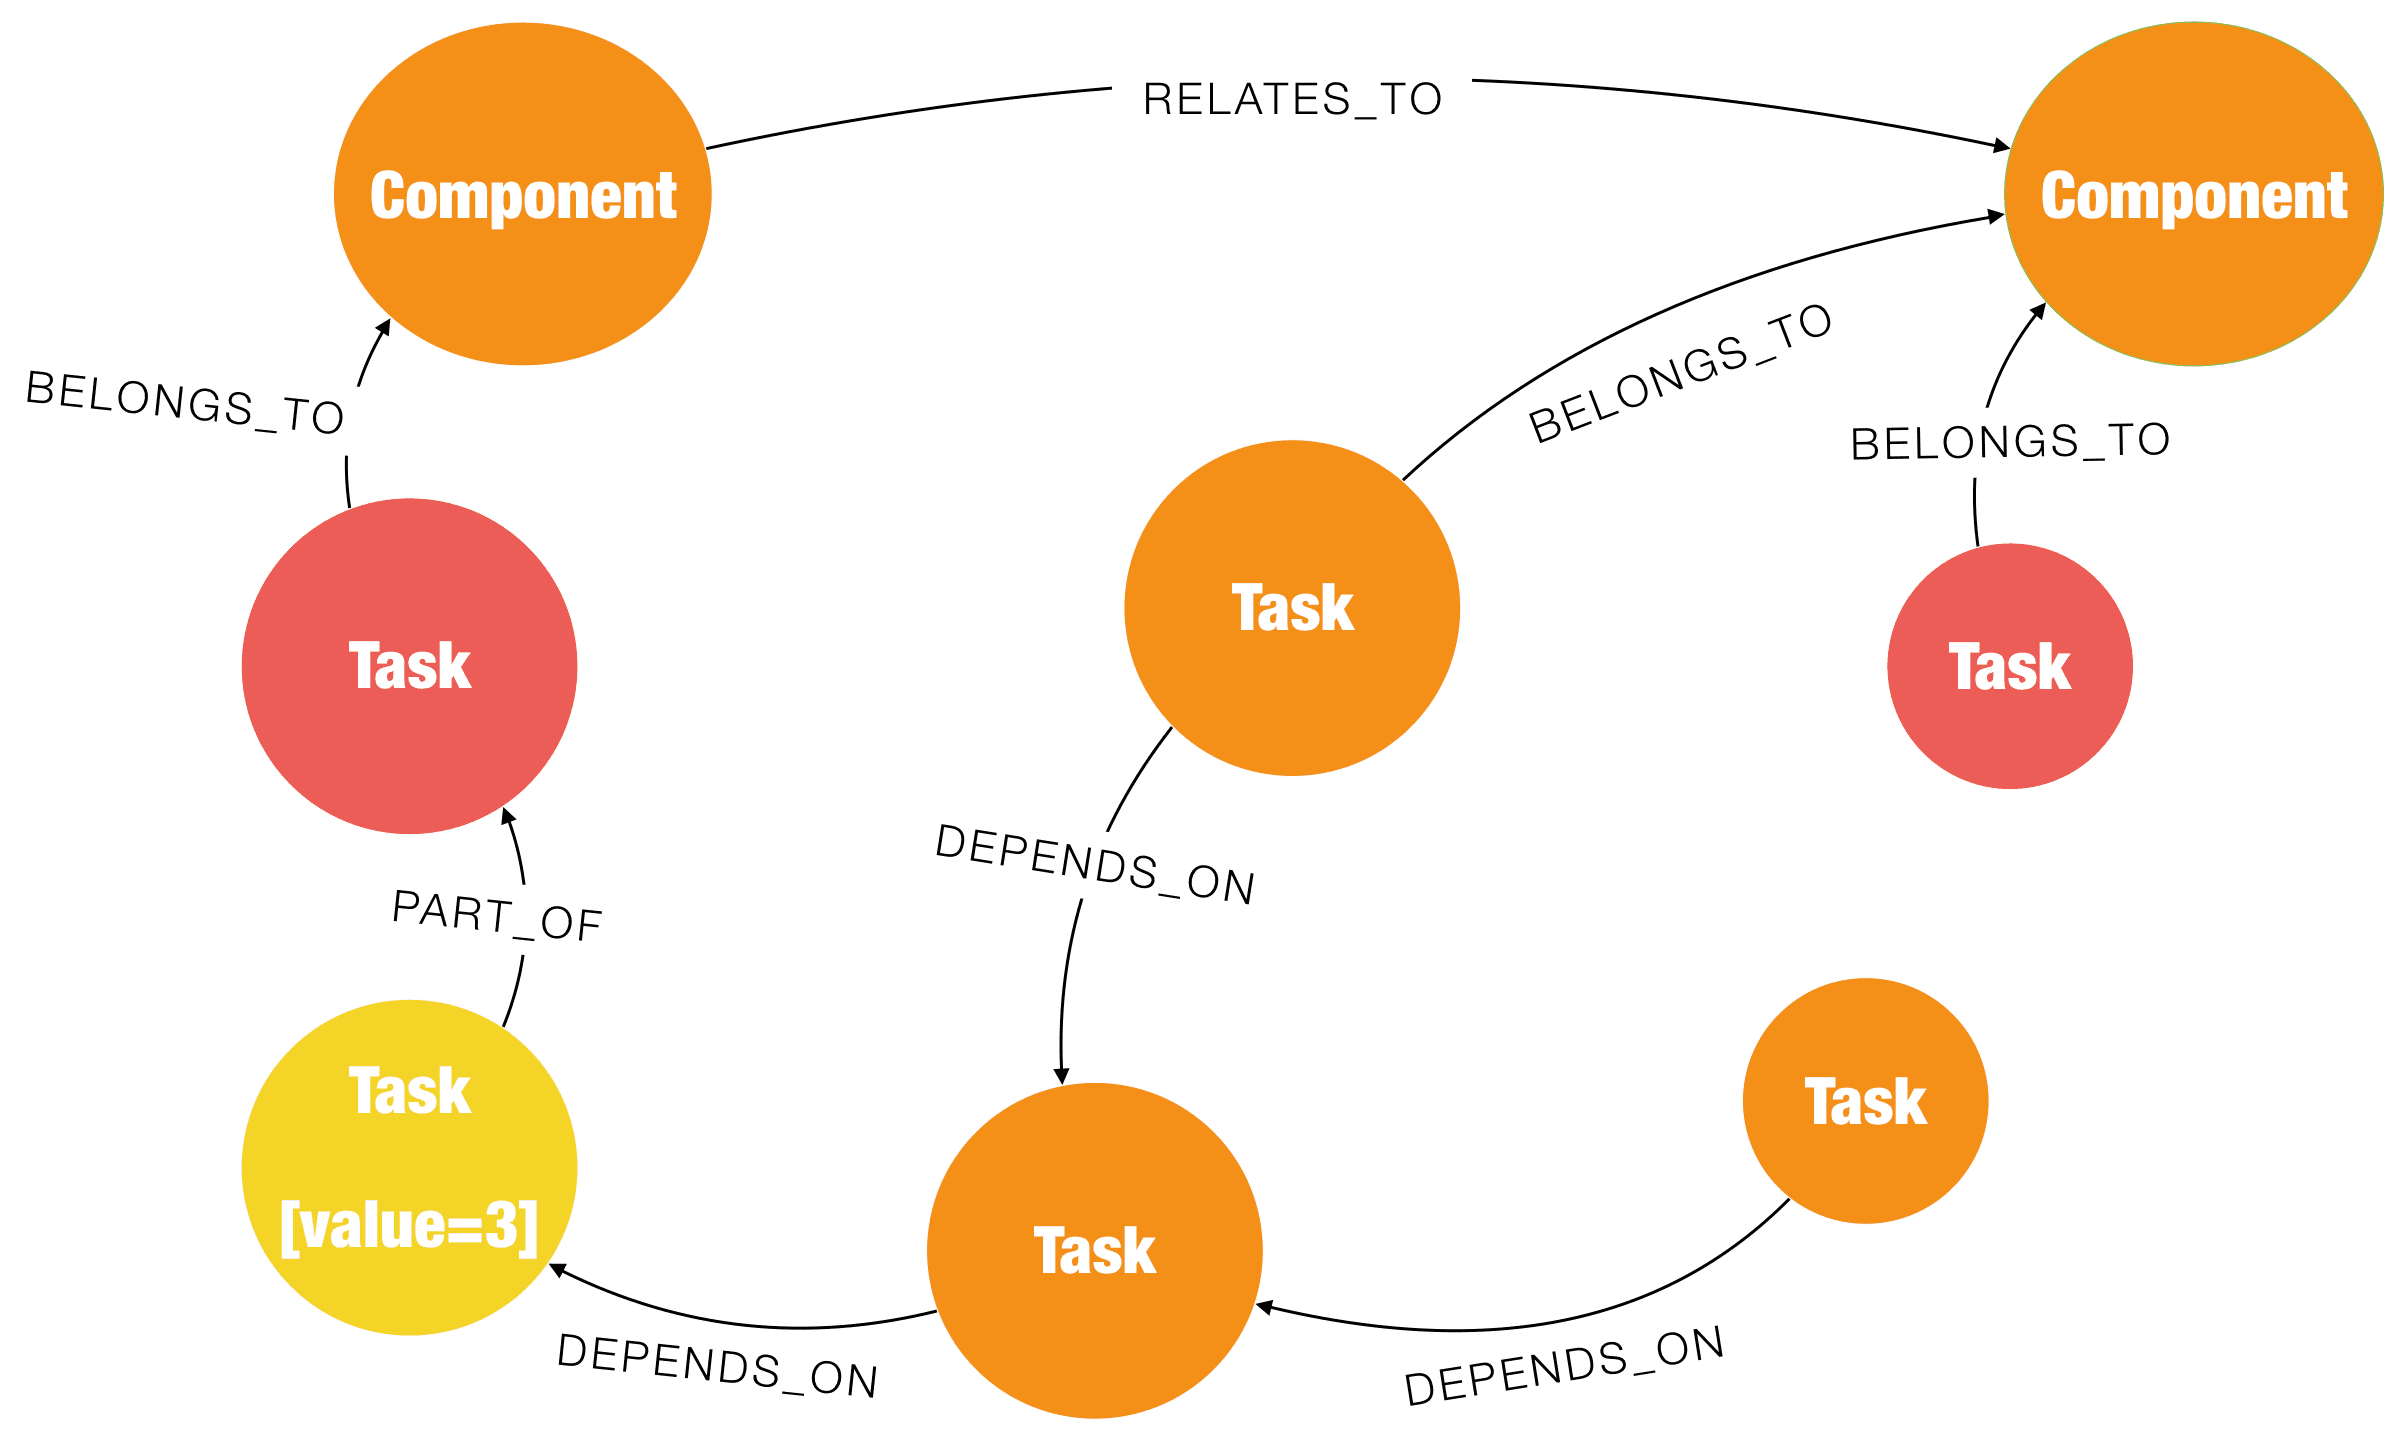
Furthermore, the components that these tasks belong to relate to other components, potentially causing other areas to be affected as well
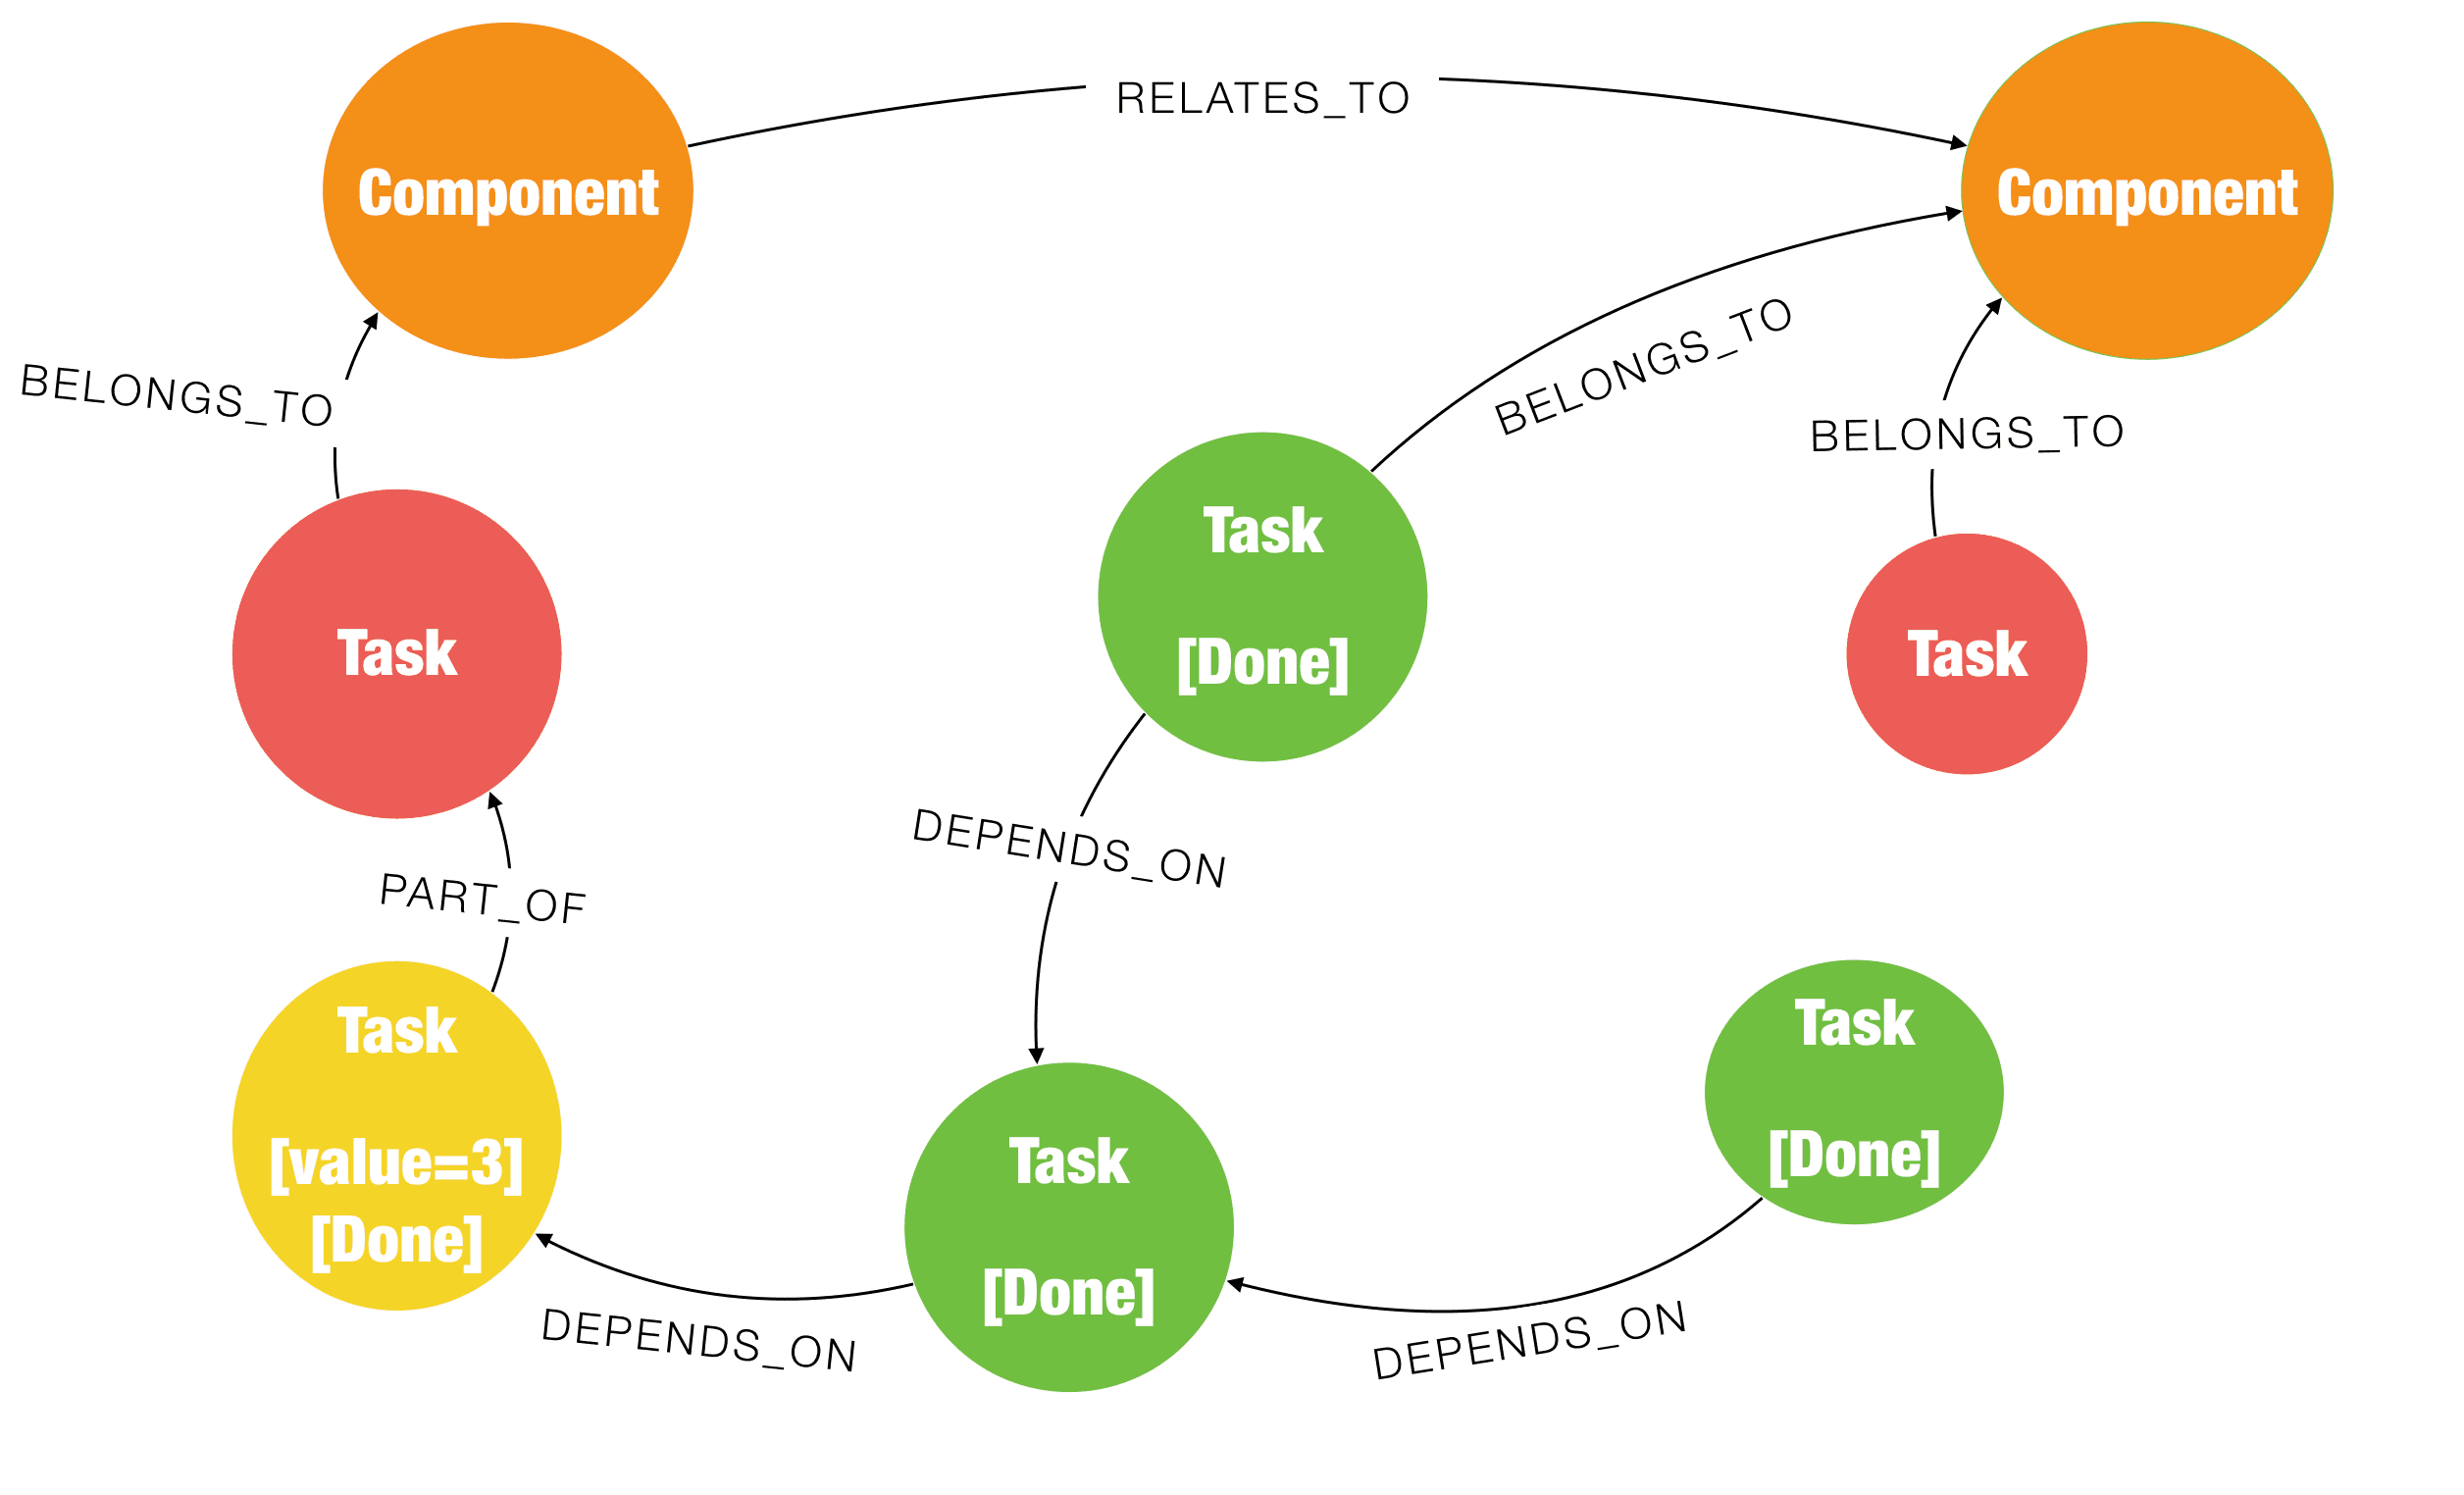
This makes matters worse when the original Task in yellow, and some of it’s dependants, were already done. Now, the impact includes re-work as well.
Prioritisation
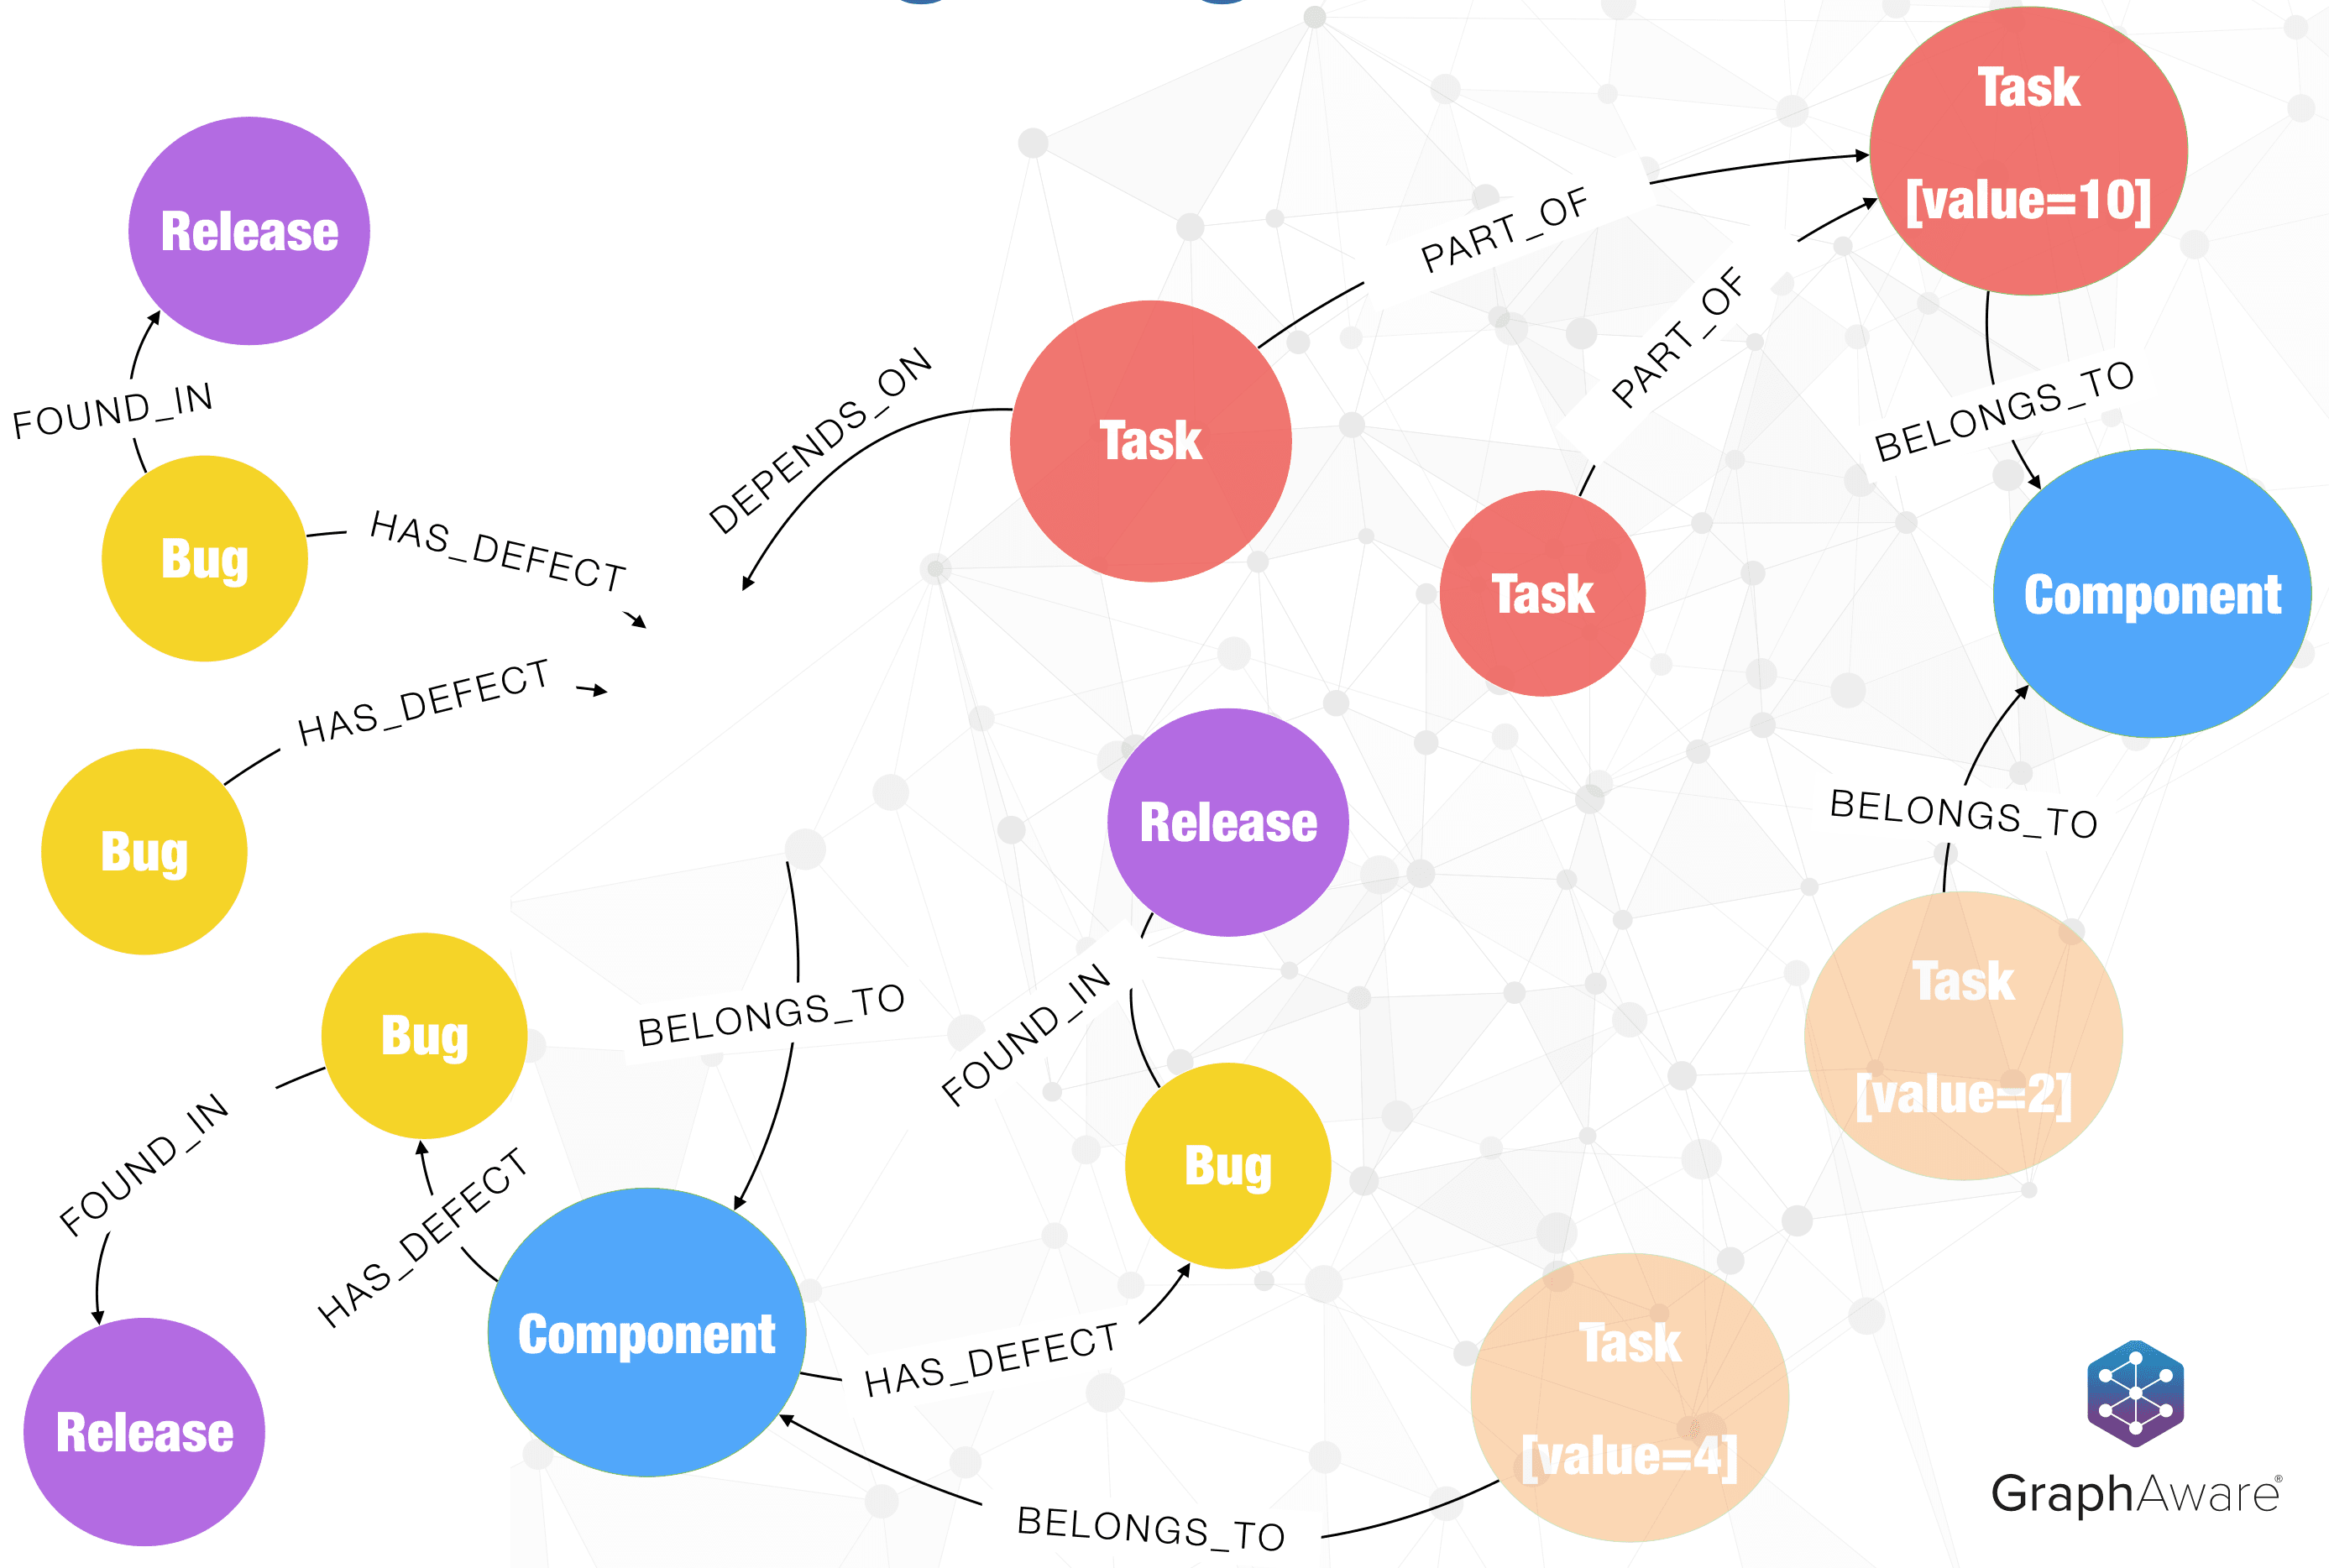
Over time, defects are raised across various releases. This happens while new features are being built. In many cases, waste is generated by prioritising new, lower-value features over refactoring to address technical debt. We extend the model to add nodes that represent Bugs and the Release in which they were found.
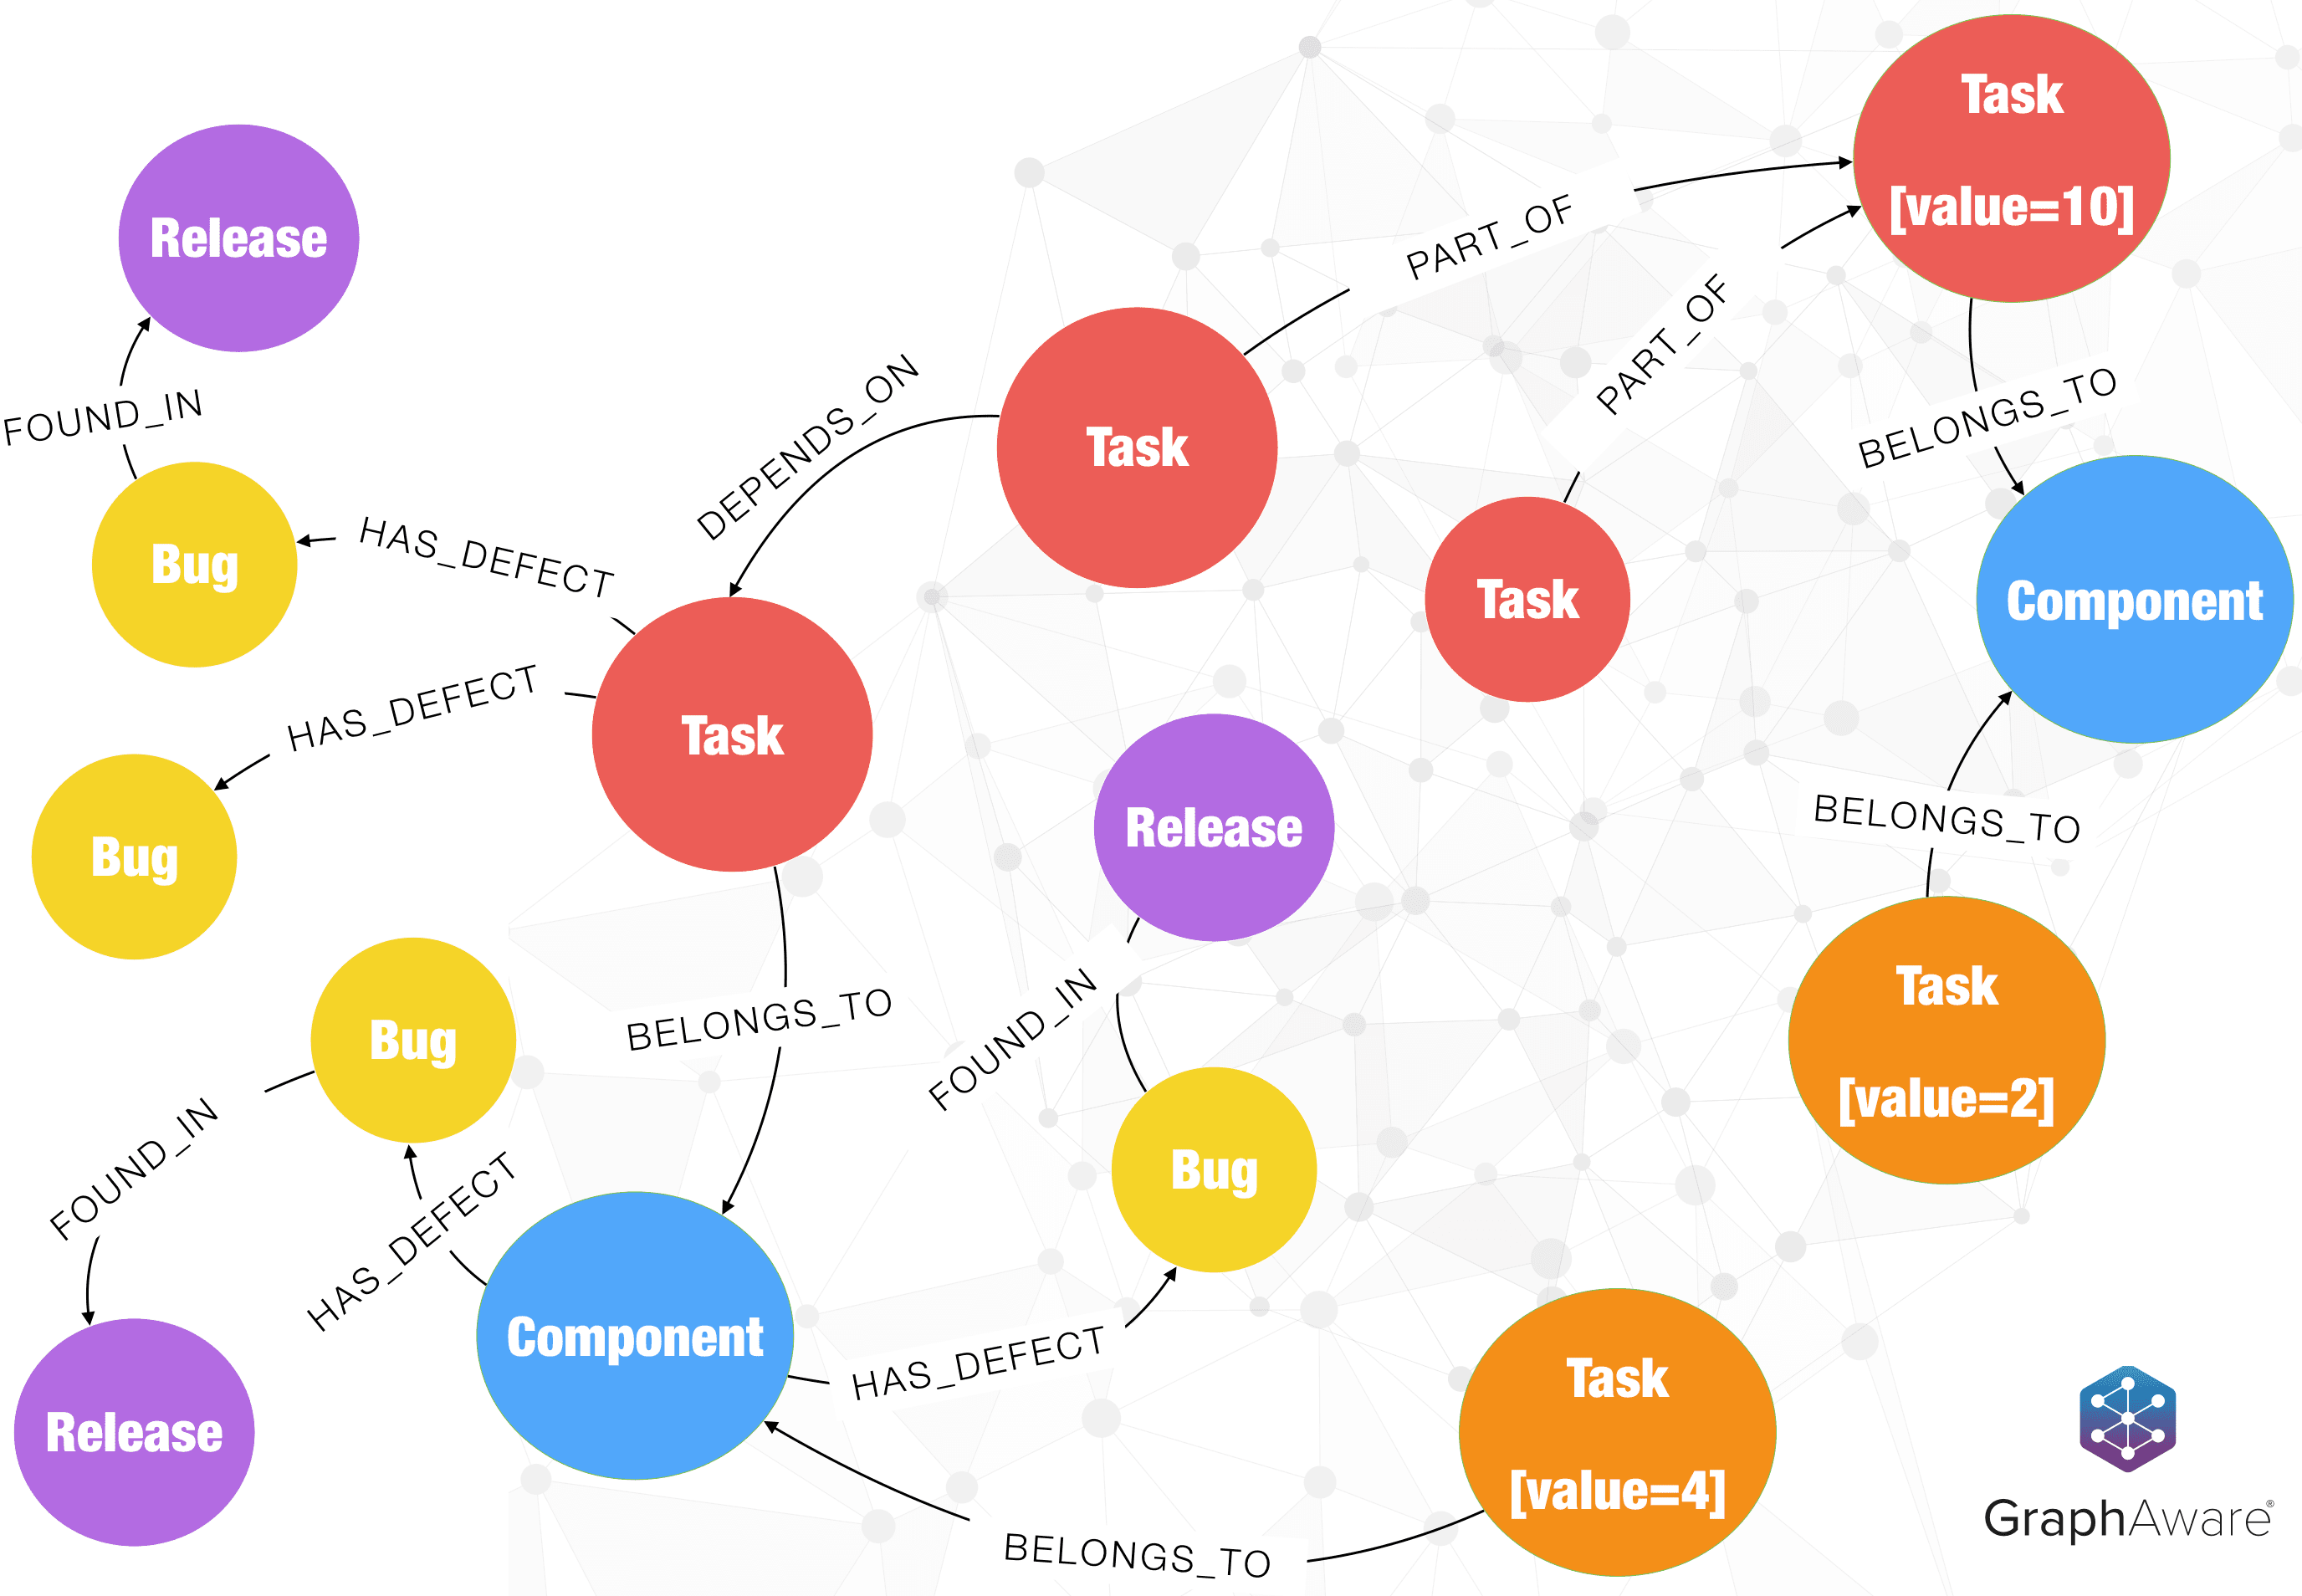
Here, the orange Task nodes are new features, with values 2 and 4, respectively. Too often, we see decisions taken that are short-sighted, wherein we deliver small features, when they are not of much value anyway (typically referred to as “low-hanging fruit”). When data is modelled as a graph, it provides us the ability to query very quickly, and we are able to delay decisions as much as possible, till they can be made on facts and not assumptions. Now that we have the data in the picture above, we can see that the priority here should be stabilising the task in red (with higher business value and therefore impact to the customer), thus addressing the waste of firefighting and re-work.
Taking it further
We’ve only scratched the surface of what can be done with graphs in the context of software delivery. Imagine adding people, teams and skills; analyse task distribution and skill fit and organise people into squads. Or use the graph to help with impact analysis around delays and risks. The same principles are easily applied to other applications in government, supply chain management and inventory control. Graphs are everywhere! Use them to improve efficiency and reduce waste.
Reference