Criminal investigations are driven by finding connections and hidden links between multiple sources of data to ultimately disrupt criminal activity. Graph solutions are a powerful tool for law enforcement to optimise their interaction with data from these varied sources.
In this blog series, Graphs in Law Enforcement, we will dig into the topic in more depth.
Criminal investigations
We all know the iconic image of investigation boards with photos, evidence, and notes, all connected with a red string. While investigators struggle with the scope and volume of evidence, sometimes all it takes is one piece of the puzzle falling into place to crack the case.
Those old-school boards are nothing else than graphs. The entities that fill them are the same that constitute the foundation of modern graph analysis. The board consists of information from different sources, collected from different agencies and different jurisdictions.
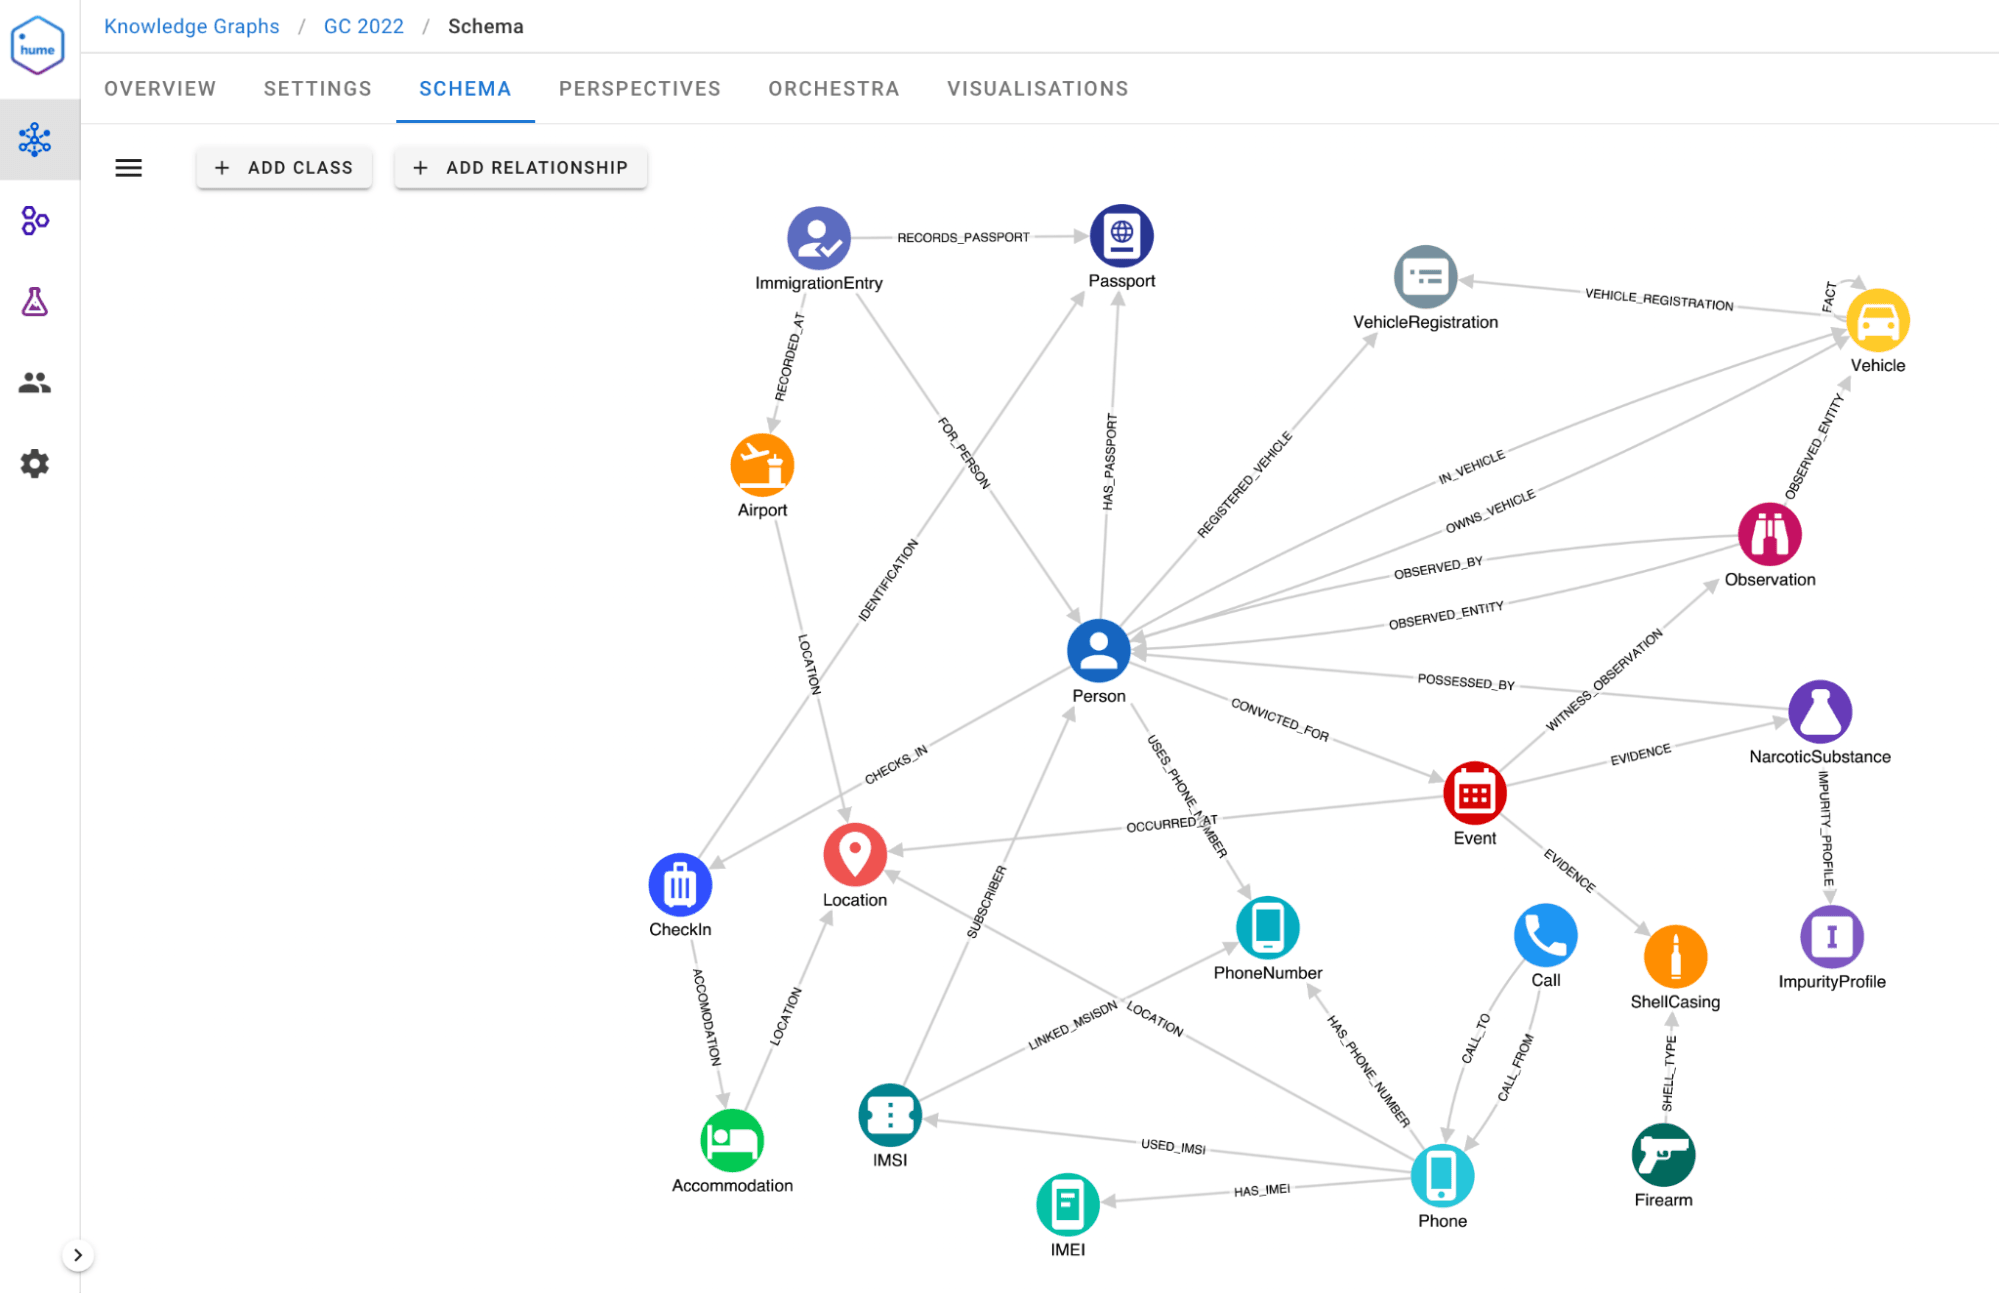
Investigators must connect the dots and create a clear picture in the graph by finding relationships between entities of interest, events, phone records, transactions, vehicles, and so on to make actionable assessments and solve cases.
Graphs in law enforcement have a few critical properties as they influence conclusions or they affect the interpretation of data by investigators. Data sources, data quality & reliability, fused entities and facts in relationships are key specifications. We will take a closer look at data sources in this blog post.
Importance of data provenance in law enforcement
Law enforcement graphs carry immense amounts of metadata, providing valuable information to analysts and investigators. The parts of metadata we are interested in are quality and source. As analysts use this data to constitute assessments, it is important to surface this information for each piece of data coming from varied databases.
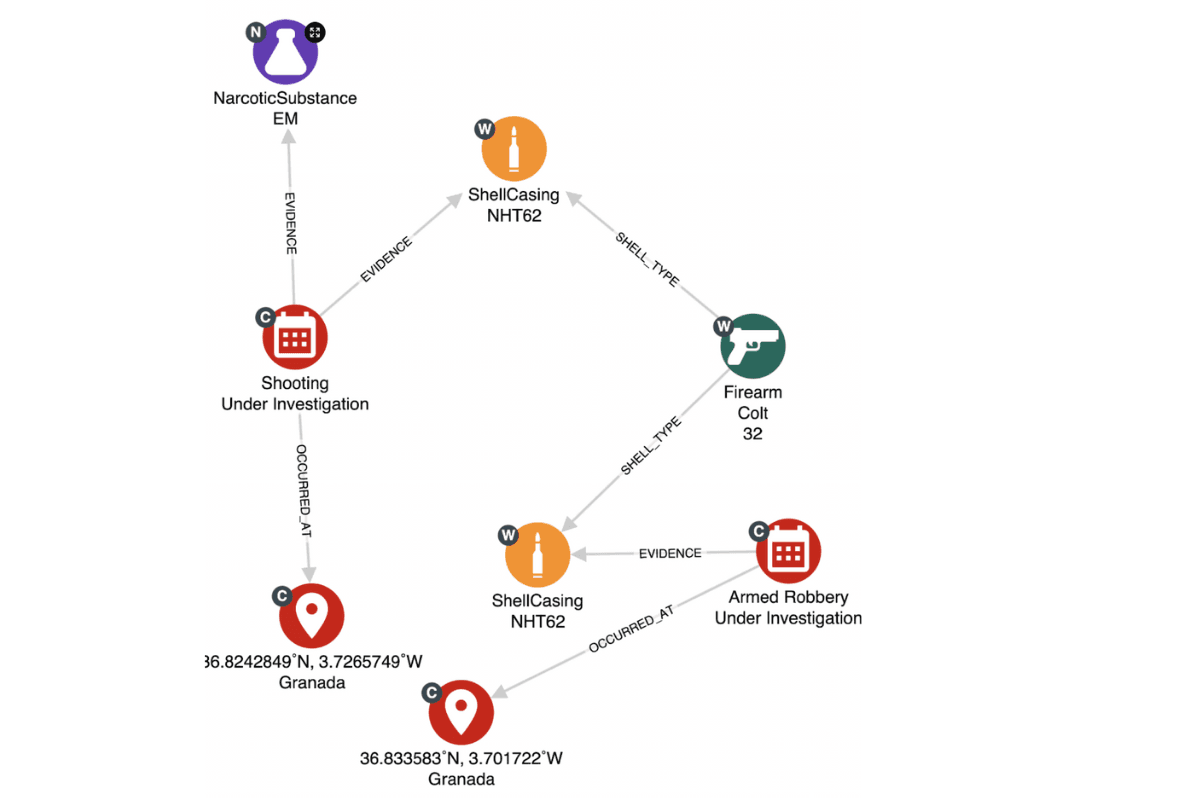
In this sub-graph, there is an image formed of a case where events or evidence might be connected. The data of these nodes comes from different databases. The small grey badges indicate the source database from which it is retrieved. The badge labelled C is the local criminal database, the W represents the weapons database, and lastly, N is data ingested from the narcotics database.
Though data is stored in independent databases, the links between them could be crucial and thus investigated.
Types of INTs
At the highest levels, data sources are referred to as INTs. INTs are Intelligence Collection disciplines; every agency and country has variations, however, generally, the terminology is shared across them all.
INTs include Signals Intelligence (SIGINT), Human Intelligence (HUMINT), Geo Intelligence (GEOINT), Forensic Intelligence and more. These disciplines are hierarchical, which is convenient for analysts or investigators as they move up and down the hierarchy.
Within these disciplines, there are more disciplines that increase in specialisation. For example, COMINT, or Communications Intelligence, captures communications between different parties, and this is a subset of SIGINT. Further down are sub-sources, which are collection methods or authorities that produce information or supply government records. An example is information from licence plates captured by speed cameras or databases with stolen weapons.
It is critical for analysts to clearly identify which piece of information comes from each data source for them to form accurate conclusions.
Modelling sources
Each use case is unique, so the modelling of the sources depends a great deal on case specifics as well as on users and stakeholders. These are the questions you should consider before you land on the optimal graph and the model.
- Do analysts want to only see the source that provided the information, or do they want to do more with it?
- Do analysts expect to traverse the graph within a particular source?
- Are sources attached only to nodes, or also to relationships?
- Are sources hierarchical, and does querying a source at a higher level imply including all child sources?
- Does access control need to be set up to grant or deny access to certain sources?
- Are the sources tied to security classification levels per source and limited accessible per analyst, based on their clearance level?
The answers to these questions will indicate whether to model sources as a node, as a label or as a property.
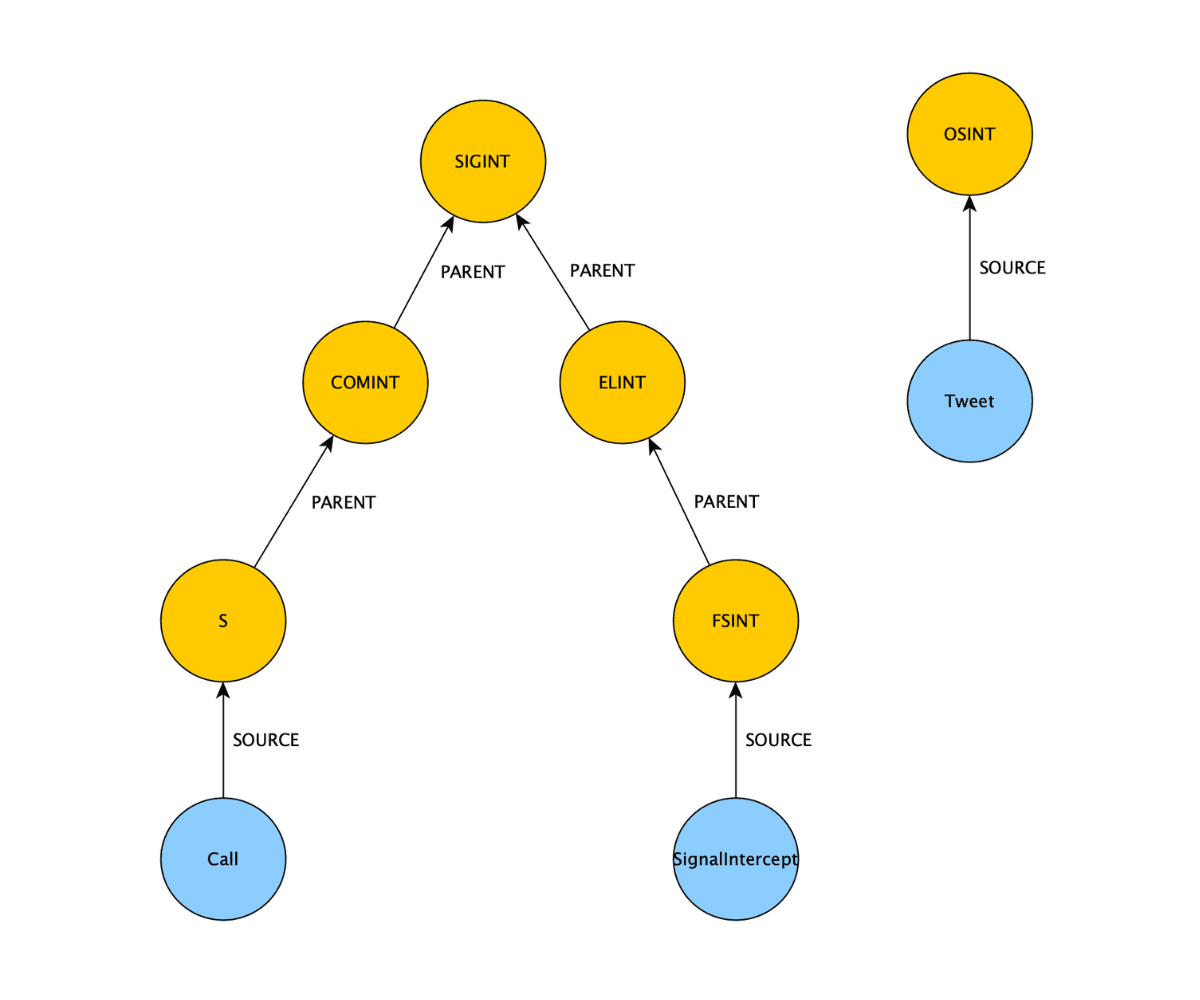
Modelling sources – as a node
In the first model, every source is a node. The yellow nodes are the sources, and the blue nodes are examples of entities that derive from these sources. The hierarchies are modelled naturally, and the sources are a fairly finite set.
Modelling with nodes:
- Hierarchies are modelled naturally
- Source-based access control is handled through the presence or absence of a path
- Sources on relationships do not fit into this model
- Supernode problem, millions of nodes, which will degrade the performance of the graph
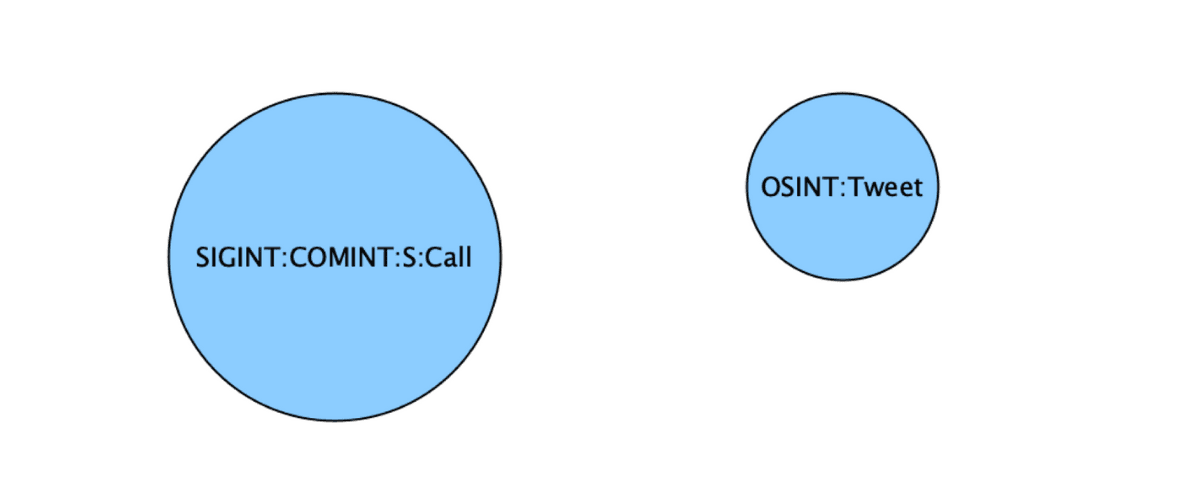
Modelling sources – as a label
In this model, users assign labels to the entities (persons, objects, locations and events) and assign them to a particular source. It is a step up from modelling sources as a node; however, it is not possible to label relationships.
Modelling with labels:
- Works for nodes, not relationships
- Hierarchy can be replicated through labels
- Label-based access control
Modelling sources – as a property
When modelling sources as a property, it is possible for both nodes and relationships. The hierarchy can be maintained separately if required. But, access control on property values is not natively supported. Lastly, test performance when you’re filtering, through e.g. OSINT or SIGINT, on a highly similar graph to your final graph.
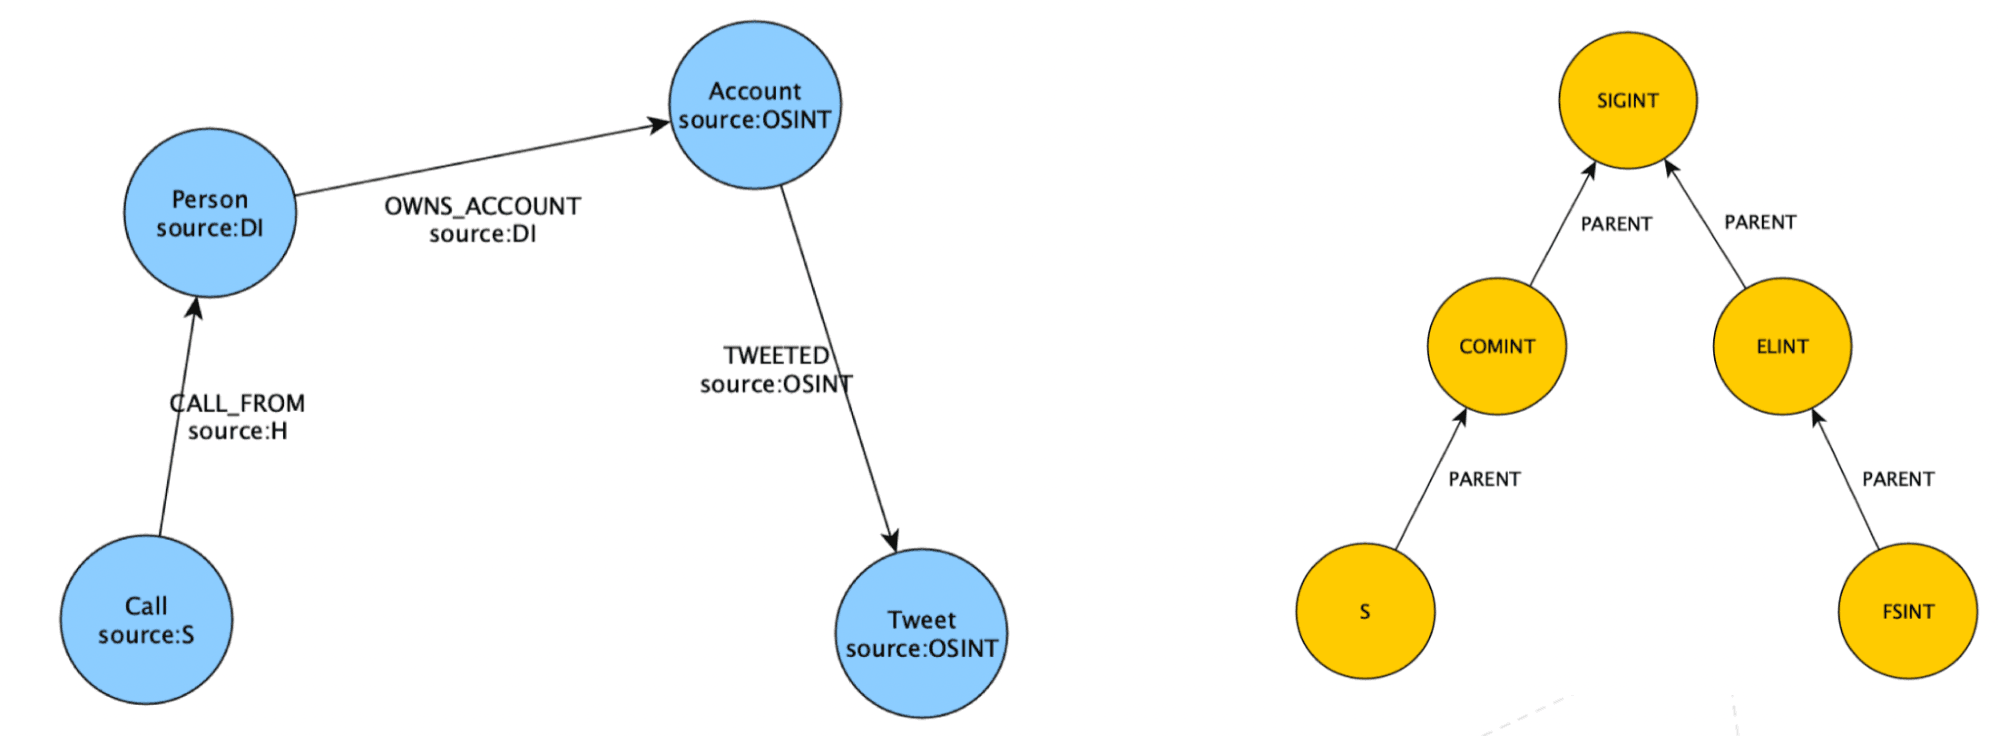
Modelling with properties:
- Both nodes and relationships
- Source hierarchy is maintained separately, and parameters are passed via queries
- Access control on property values is not supported natively
- Test performance when filtering on sources when traversing
Sources modelled as a property
In this video, you can see a graph with the sources modelled as properties, on both the nodes and relationships. There is the ability to expand through sources and turn on and off different layers.
Analysts and investigators can easily navigate through a graph with a solution like GraphAware Hume. Work confidently with various sources to explore nodes and relationships to form assessments and find answers.
In the next part of the blog series, we will speak about data quality and credibility. For a video showcasing these topics and more, check out the talk Tracking Data Sources of Fused Entities in Law Enforcement Graphs by our VP of Engineering, Luanne Misquitta.