In our previous blog post, ”The challenges of intelligence analysis and how graphs solve them”, we saw how graphs truly streamline and enhance the workflow for intelligence teams. The next step in the process is setting up your graph.
“What is the optimal schema for our graph?” is one of the questions we get asked most as a graph solution provider and Neo4j consultancy. The answer to this is, “It depends.” In this blog post, we will discuss how to approach the implementation of graphs and the different types of graph schemas we see in the intelligence domain.
Schema design considerations
Once you get started with graphs, one of the first things you encounter is schema design. The optimal schema design of the graph depends on the use case and the end-users of your graph. The design must be use-case driven, and therefore these are things one should consider:
- Who are the users of the graph?
- What type of analysis do they want to conduct?
- What data do they need to meet the use case?
- What queries are going to be written to meet this use case?
The answers to these questions will determine how you can create an effective schema that will serve the use case. Graph schemas and the use case being served must stay aligned. A general rule that can be applied with graph schema is that if a node or relationship is not explicitly referenced in a graph query serving your use case, then consider merging it with another graph object to keep the schema clean. However, as with all general rules, there are edge cases where this doesn’t apply.
Types of schemas for intelligence graphs
In the intelligence domain, we see four types of graph schemas: the exploratory graph, the domain-specific graph, the tactical graph and the sandpit graph. Let’s walk through the four options and their properties.
1. Exploratory schema
Exploratory graphs are built to visualise and explore the data across many sources and domains. Intelligence analysts and investigators often seek to explore all available datasets for linkages between entities of interest. For this use case, there may not be any specific query or analysis that needs to be performed; instead, analysts want to visually explore the data from multiple source systems. POLE is a great example of an exploratory graph; it stands for Persons, Objects, Locations and Events. Data from multiple source systems is ingested and generalised to fit a tightly managed graph schema.
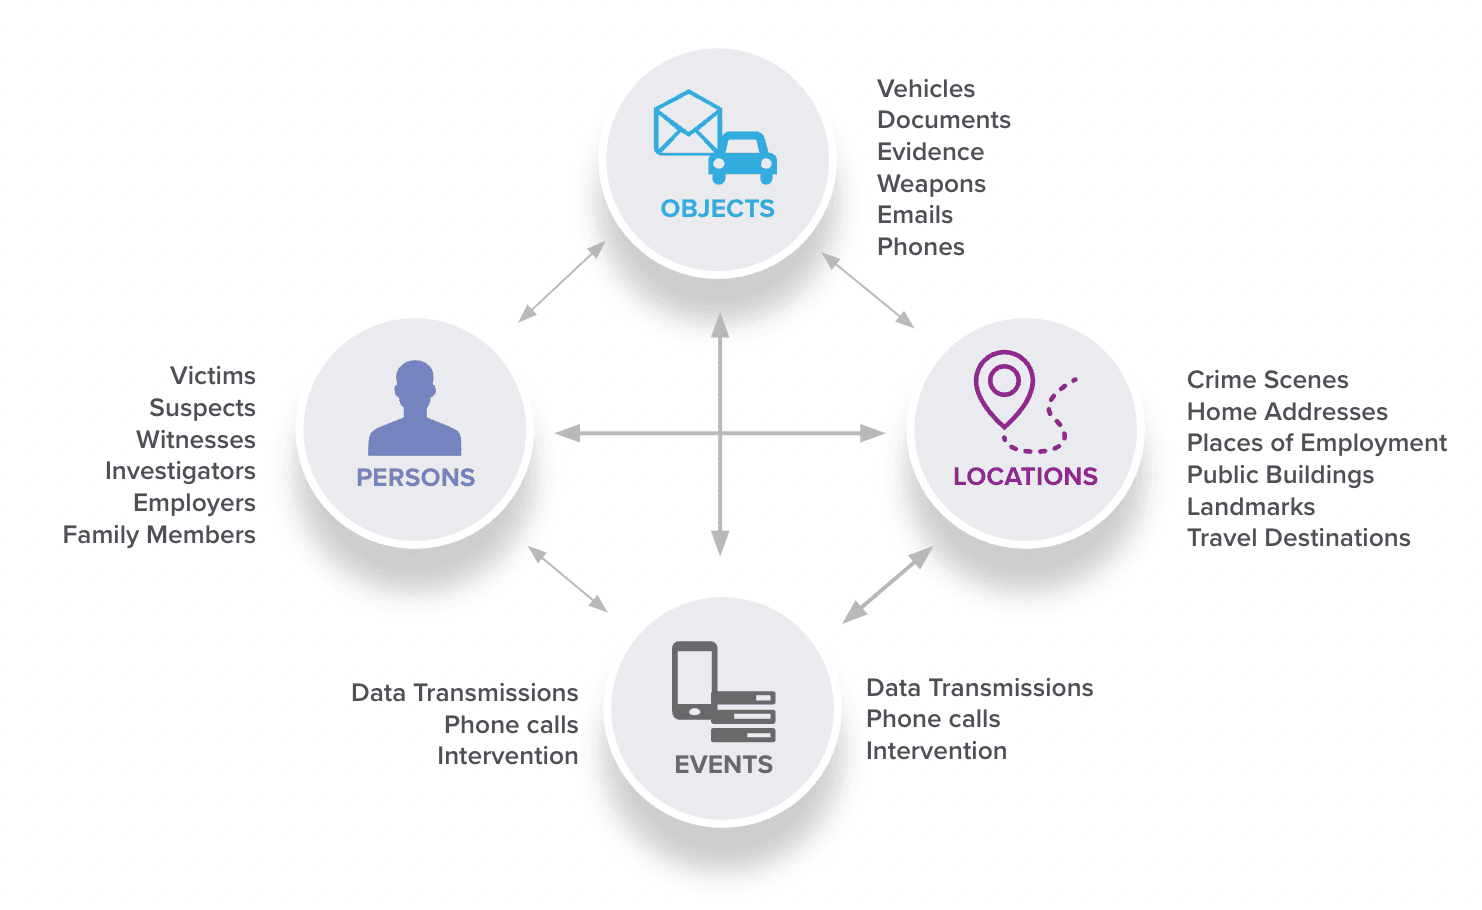
Exploratory graphs summarise your intelligence. They:
- Simplify representations of many sources of information
- Make key intelligence findings and linkages between sources accessible
- Are particularly useful when analysts don’t know exactly what they are looking for and must traverse multiple sources to obtain valuable insight.
2. Domain-specific schema
Domain-specific graphs are schemas that show the full context of a specific domain. The telecommunications graph schema below is an example of this. Here, the full context for a phone call is shown, including IMEI and IMSI numbers and the cell towers used for the call. Where the exploratory graph reduces and summarises information, the domain-specific graph enables the full, rich context of the domain to be represented fully. In an exploratory graph, a phone call may simply be represented as a CALLED relationship between two persons. In the domain graph, however, the full context is shown.
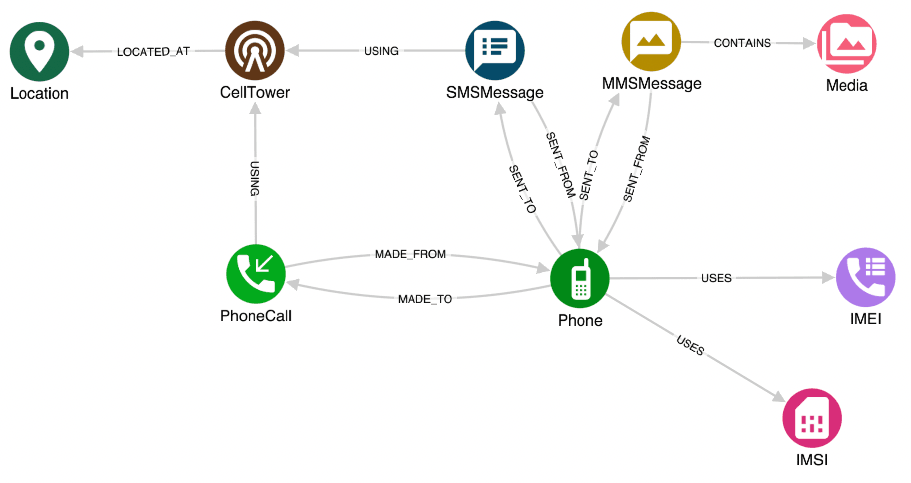
- Domain-specific graphs provide a detailed representation of data
- Show the full context that is relevant to the domain
- Allows for ‘drilling into’ the details within the data
- Multiple sources of data within the same domain can be used
- Important to not mix domains, as visualisations become cluttered and queries are non-optimised
3. Tactical schema
Tactical graphs are built to serve a specific operation or investigation. Here, data from both existing corporate systems and data collected specifically for an operation are merged into the same graph. Tactical graphs include data that can only be used for specific use cases and have restrictions on who can see the information and how it can be used. Therefore, the access controls used for a tactical graph are a key consideration. An example of a tactical graph may be a specific operation looking into an organised crime syndicate. Information from corporate sources, as well as data collected specifically for this operation, is merged. The collected data can only be viewed by a certain group of analysts and can only be used for this specific operation. The tactical graph provides a place where all of this data can be loaded and analysed, whilst access is controlled.
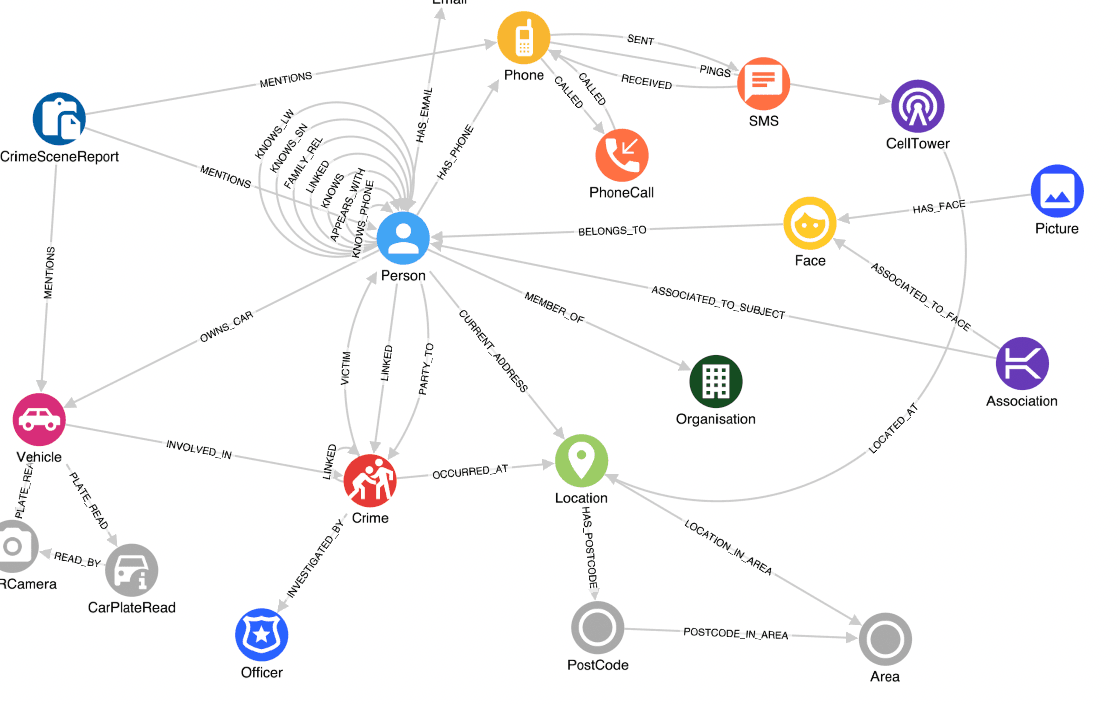
- Tactical graphs are created to serve specific operational use cases
- Uses a blend of “corporate” data sets and specific files collected for an operation
- Access is often limited to a specific group of users
- Some data is only relevant or usable within a specific context
- Collaboratively built and populated by intelligence teams
4. Sandpit schema
A sandpit graph is a “local” graph for single-use analysis where ad hoc data sets can be uploaded and analysed. Analysts can take a local file, upload it to the graph, and analyse it visually. After using this graph, it can be either discarded or stored for the long term.
An example of this would be purchase records relevant to a specific investigation. After loading and analysing the file, no significant findings are made, and the file is discarded.
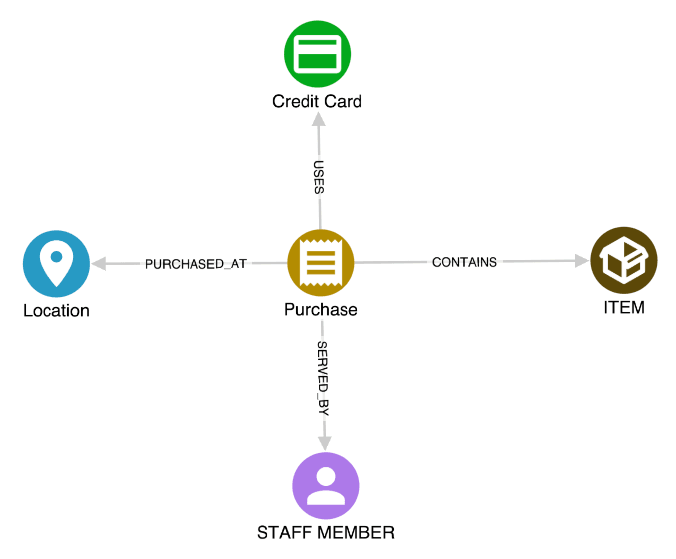
- Sandpit graphs allow analysts to upload a data file and analyse it in a graph
- These datasets can then be merged into tactical or domain graphs if required
- Often, the file is analysed and then discarded
- All of the benefits of a “local” graph, with a server-based application
Conclusion: Important considerations for intelligence graphs
With the given examples and types of graph schema, we see it is critical to carefully consider the graph schema you will need for your use case. Always keep the users, most likely the intelligence analysts, in mind. To reduce complexity and clutter, create multiple graphs for different use cases. A graph that is developed for all use cases is optimised for none.
Graph analytics solutions have immense potential for the intelligence process. See how Hume was leveraged to optimise a law enforcement agency’s intelligence process and analysis at a cybersecurity agency.
Would you like to find out more about graphs in criminal intelligence or see a demonstration of Hume? We showcased this and more in our Graphs in Criminal Intelligence webinar.