Call Detail Records (CDRs) offer a wealth of potential insights, but their analysis is hindered by several challenges. Traditional tools struggle to handle the massive volume and intricate structure of CDR datasets, often limited to static and linear data views. This makes it difficult to identify complex patterns, relationships, and anomalies. Furthermore, fragmented workflows and manual tasks slow down analysis and increase the risk of errors. To fully harness the value of CDR data, more advanced, integrated solutions are necessary to address these limitations and enable efficient, comprehensive analysis.
Why connected data is ideal for call detail records analysis
Call Detail Records analysis hold immense potential, but their complex and interconnected nature makes extracting actionable insights a challenge for traditional tools. Static, table-based approaches fail to reveal the hidden relationships and multi-step connections that are critical in investigations.
GraphAware Hume, a graph-native connected data analytics platform, transforms CDR analysis by leveraging the inherent relationships within the data. With its ability to map dynamic networks, handle massive datasets, detect patterns, and integrate external intelligence sources, Hume empowers analysts to uncover hidden connections, identify key players, and generate actionable insights with speed and precision.
This chapter explores how connected data and Hume’s graph-native capabilities address the limitations of traditional tools, enabling a more comprehensive and effective approach to CDR analysis.
The power of a graph-native tool
GraphAware Hume leverages graph databases, such as Neo4j, to represent CDR data as networks of interconnected entities, which aligns naturally with the structure of communication records.
- Modelling relationships naturally: Graph databases excel at representing connections—whether between phone numbers, locations, or timestamps—making it easier to map interactions and associations within large datasets.
- Intuitive visualisation: GraphAware Hume provides powerful visualisation tools that allow analysts to see complex connections at a glance. Networks of calls, common contacts, or geospatial overlaps can be explored interactively, enabling faster and more informed decision-making.
This graph-native approach transforms static, linear data into dynamic, relational insights, empowering users to uncover patterns that traditional tools often miss.
This graph-native approach transforms static, linear data into dynamic, relational insights, empowering users to uncover patterns that traditional tools often miss.
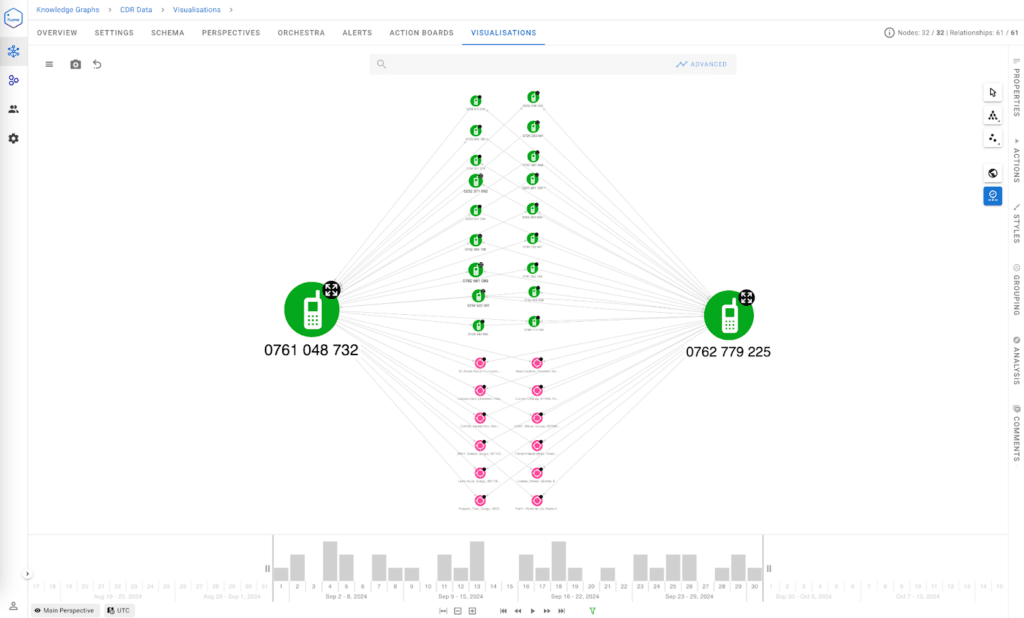
Advanced data visualisation
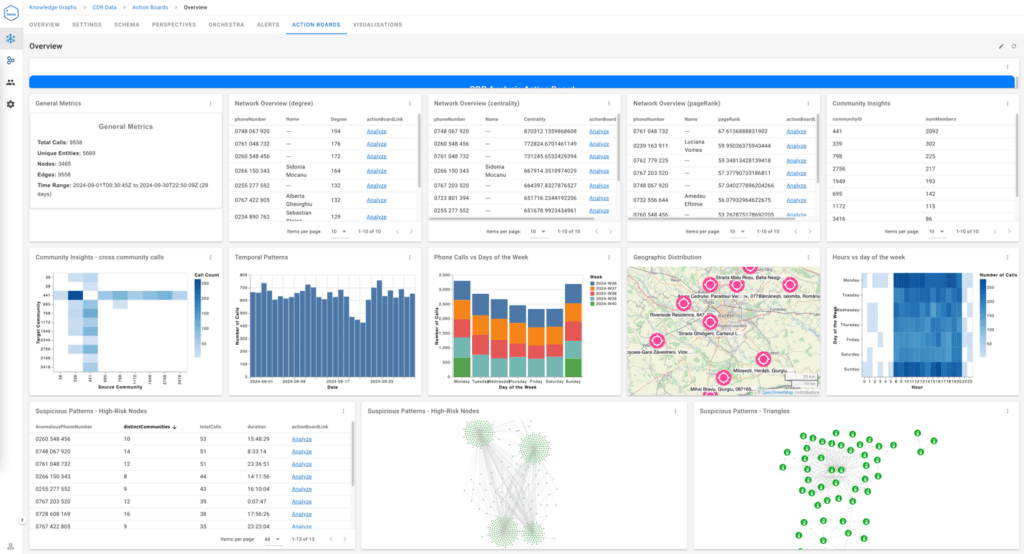
GraphAware Hume’s Action Boards are a game-changer for analysts working with complex datasets, providing a centralised, interactive dashboard that delivers a comprehensive snapshot of the data at once. These boards allow users to visualise the entirety of their dataset in an intuitive and structured format, showcasing key metrics, relationships, and trends in real time. By integrating data from multiple sources into a single interface, Action Boards eliminate the need to switch between tools or manually cross-reference information, saving valuable time and reducing the risk of oversight.
With customisable widgets and dynamic visualisations, analysts can tailor their view to focus on the most relevant data points, such as high-priority alerts, anomalies, or emerging patterns. This holistic approach enables rapid identification of critical insights and connections, empowering users to make informed decisions with confidence. Whether it’s mapping networks, identifying clusters, or monitoring real-time activity, GraphAware Hume’s Action Boards transform raw data into actionable intelligence, providing the clarity and efficiency needed for high-stakes investigations and analysis.
Advanced analytics for CDR data
GraphAware Hume enhances CDR analysis through advanced features designed to identify entities, relationships, and anomalies in vast datasets.
- Entity extraction and linking: GraphAware Hume automatically extracts and links critical entities, such as phone numbers, call timestamps, and geolocations, from structured and unstructured data sources.
- Relationship detection: By analysing the graph structure, GraphAware Hume can identify key relationships, such as frequent contacts, clusters of interconnected individuals, or suspicious communication patterns.
- Pattern recognition: Advanced algorithms detect anomalies, such as unusually high call volumes or calls outside of typical time ranges, which could indicate fraud or illicit activities.
These analytics capabilities reduce manual effort and ensure that actionable insights are surfaced efficiently.
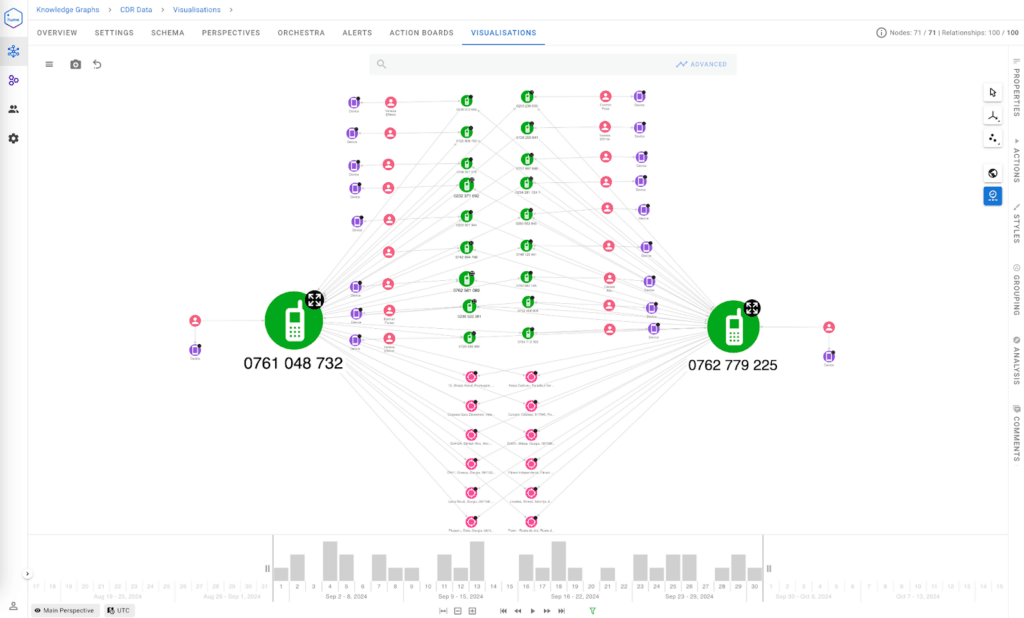
Seamless integration and enrichment
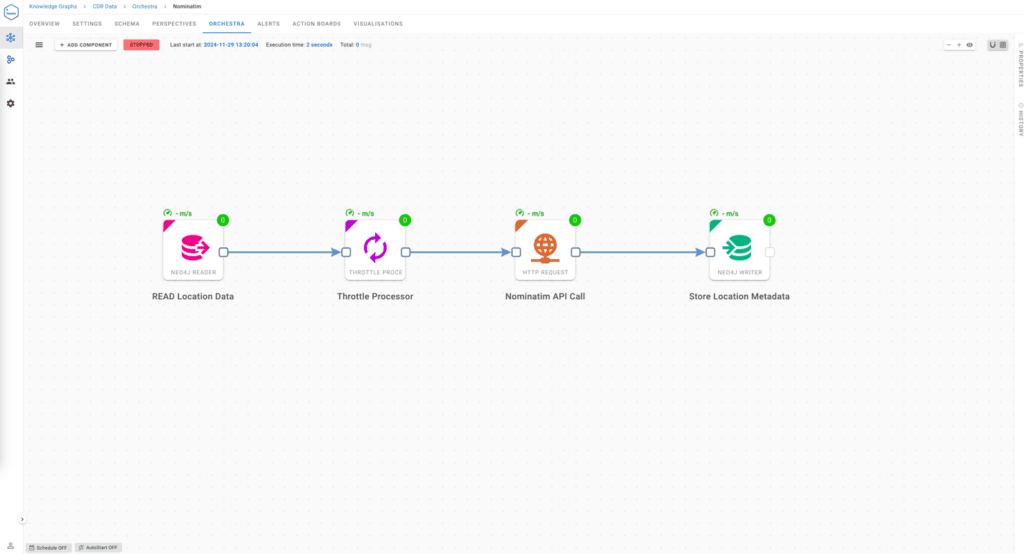
Hume Orchestra is a powerful component of GraphAware Hume that enables real-time data processing, advanced analytics, and seamless enrichment of Call Detail Records (CDRs). Designed to handle complex and dynamic datasets, Hume Orchestra ensures that analysts can extract actionable insights quickly while maintaining a holistic view of the data.
Key capabilities of GraphAware Hume Orchestra
- Real-time data ingestion and processing
GraphAware Hume Orchestra can ingest CDR data streams in real time from multiple sources, including telecom providers, internal databases, and external intelligence feeds. By processing data as it arrives, analysts can monitor live communication patterns, detect emerging events, and respond to time-sensitive scenarios instantly. - Automated data enrichment
One of Orchestra’s standout features is its ability to enrich raw CDR data by integrating it with external datasets. This includes:- OSINT data: Overlay open-source intelligence to provide additional context, such as connections to individuals, locations, or organisations.
- Geospatial enrichment: Combine cell tower data with location intelligence to track movement patterns or identify meeting points.
- Alias resolution: Cross-reference device dumps (e.g., Cellebrite) to resolve individuals using multiple SIM cards or devices.
- Financial and internal data: Integrate transaction records, criminal reports, and internal intelligence to build a complete investigative picture.
- For example, Orchestra can automatically identify if multiple phone numbers (e.g., from CDRs) share the same device, linking alias identities in fraud or organised crime cases.
- Advanced analytics and automation
Hume Orchestra leverages graph algorithms and machine learning to perform advanced analytics, such as:- Pattern detection: Identify frequent communication groups, unusual spikes, or outlier behaviours.
- Network analysis: Detect brokers, influential nodes, and multi-step connections within large datasets.
- Anomaly detection: Highlight irregular patterns in call duration, timing, or frequency that could indicate illicit activity.
- By automating these processes, Orchestra reduces manual effort and accelerates the discovery of meaningful insights.
- Scalable and flexible integration
Hume Orchestra supports flexible workflows, allowing analysts to integrate data seamlessly from multiple formats and sources. It normalises and aligns data dynamically, ensuring consistency across records even when formats vary (e.g., +420123456789 vs. 00420123456789). This flexibility enables analysts to focus on analysis rather than manual data reconciliation.
This seamless integration streamlines workflows, eliminates the need for tool switching, and amplifies the power of CDR analysis with additional context and insights.
With its graph-native capabilities, advanced analytics, and seamless data integration, GraphAware Hume is uniquely positioned to overcome the challenges of traditional CDR analysis. Whether for law enforcement, intelligence, or corporate investigations, GraphAware Hume equips analysts with the tools they need to uncover the hidden stories within complex datasets. For example, the Western Australia Police Force deployed a graph database platform powered by GraphAware Hume and Neo4j: within four months, they were able to ingest data from data silos scattered throughout the organisation and create a consolidated single view of intelligence. Data queries that once took hours now happen in an instant, empowering law enforcement to act swiftly and dynamically react to changes in real time.
Why it matters for CDR analysis
Traditional CDR tools struggle with static, fragmented, and incomplete data. Hume Orchestra overcomes these limitations by:
- Delivering real-time processing for time-sensitive investigations.
- Automating data enrichment to provide deeper context and connections.
- Applying advanced analytics to uncover hidden patterns and relationships.
With Hume Orchestra, analysts can dynamically process, enrich, and analyse CDR data at scale, ensuring a faster and more comprehensive understanding of communication networks. This empowers investigative teams to make informed decisions, uncover hidden narratives, and act with confidence.
Graph data science for CDR investigations
Graph Data Science (GDS) enhances the Call Detail Records analysis by leveraging sophisticated algorithms to uncover hidden patterns, relationships, and behaviours. By applying graph algorithms to CDR data, investigators can gain deeper insights into communication networks, making GraphAware Hume an indispensable tool for CDR investigations.
Graph algorithms for community detection identify clusters of interconnected nodes—such as groups of phone numbers that frequently communicate. These clusters are pivotal for identifying relationships and patterns within Call Detail Records analysis, providing actionable insights for investigators.
Uncovering criminal networks
Community detection can reveal clusters of individuals that form tight-knit groups, such as organised crime rings or fraud syndicates, by analysing patterns of frequent, reciprocal, or highly specific communication. For example, if multiple phone numbers exhibit repetitive, closed-loop calling behaviour within a short time frame, it could indicate coordination within a criminal cell. Analysts can then overlay additional data—like location patterns or external intelligence—to confirm the existence of a network.
Detecting close-knit groups
These algorithms also help identify social or professional groups based on shared communication behaviour, enabling investigators to focus on relevant entities. For instance, detecting a group of employees who frequently communicate outside of working hours might suggest potential information leaks, collusion, or corporate espionage.
Benefits for CDR investigations
- Prioritising investigations: By automatically clustering entities into communities, analysts can quickly prioritise areas of interest and focus resources on the most relevant or suspicious groups.
- Behavioural insights: Community detection helps uncover behavioural dynamics, such as key communication hubs (e.g., leaders or coordinators), brokers connecting separate groups, or outliers whose communication behaviour differs significantly.
- Dynamic visualisation: With tools like GraphAware Hume, community detection outputs can be visualised dynamically. Investigators can explore clusters interactively, identify connections within and between communities, and track changes over time.
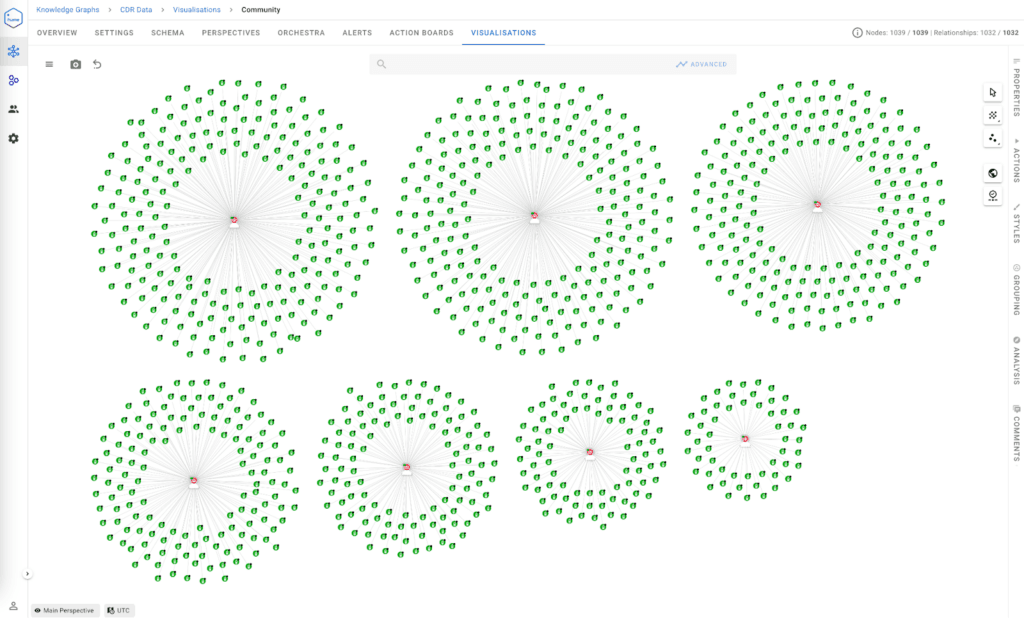
By identifying these communities, analysts can quickly prioritise areas of interest and focus resources on groups that exhibit suspicious or anomalous activity.
PageRank and centrality analysis in CDR analysis
In Call Detail Records analysis, PageRank and centrality measures play a critical role in identifying key nodes(individuals, devices, or entities) and understanding the structure of communication networks. These graph algorithms provide insights into the influence, importance, and roles of specific nodes within a network, enabling investigators to uncover hidden relationships and prioritise targets.
1. Identifying key nodes with PageRank
PageRank, originally developed to rank web pages, measures the relative importance of nodes within a network based on their connections. In CDR analysis, this translates to identifying individuals or devices that serve as central hubs of communication.
- Practical use case:
Consider a criminal network where multiple phone numbers communicate frequently. PageRank highlights the most influential nodes—those with numerous connections or connections to other highly connected individuals.- For instance: If Person A communicates with 20 different individuals, while Person B connects to only 2, Person A will have a higher PageRank. However, if Person B’s connections are to other central figures, their importance increases, as PageRank accounts for both quantity and quality of connections.
- Value in investigations:
- Identify leaders or coordinators in organised crime or fraud networks.
- Prioritise key individuals who act as information hubs in the network.
Example: A CDR analysis reveals Person X as the “most important” node because they have direct and indirect connections to all other critical individuals. PageRank allows investigators to focus efforts on Person X as a likely leader or facilitator.
2. Highlighting network roles with centrality measures
Centrality algorithms determine the position and influence of nodes within a network based on various metrics. Different centrality measures provide unique perspectives on the structure and behaviour of communication networks:
- Degree centrality:
Measures the number of direct connections a node has.- Use case: Detect individuals making a high volume of calls or messages, indicating key communicators or coordinators.
- Example: A suspect with a high degree of centrality may be managing communications within a fraud ring.
- Betweenness centrality:
Identifies nodes that act as bridges or intermediaries between other nodes.- Use case: Highlight individuals who facilitate communication between disconnected groups (e.g., brokers in criminal networks).
- Example: A person connecting two isolated clusters could indicate a middleman or information courier. Removing this node could disrupt communication flow.
- Closeness centrality:
Measures how quickly a node can reach all others in the network.- Use case: Identify individuals who are well-connected and capable of disseminating information quickly.
- Example: In a time-sensitive investigation, nodes with high closeness centrality might be key for spreading instructions or coordinating activities.
3. Describing the network
PageRank and centrality measures together allow investigators to understand the broader structure and dynamics of a communication network:
- Hubs and influencers: Key individuals who drive communication, such as leaders or coordinators.
- Brokers: Intermediaries who bridge otherwise disconnected parts of the network.
- Clusters: Groups of tightly interconnected nodes that may indicate coordinated activity.
- Outliers: Individuals who are weakly connected but may play niche or emerging roles.
Practical examples in CDR analysis
Imagine analysing CDR data for a suspected drug trafficking ring:
- PageRank identifies the most influential phone number (e.g., the leader) as the central hub of communication.
- Betweenness centrality highlights a broker who connects multiple groups (e.g., supplier, transporter, and distributor).
- Degree centrality reveals a heavily connected node making frequent calls to multiple individuals.
By combining these insights, investigators can:
- Map out the hierarchy of the network (leaders, intermediaries, and subordinates).
- Prioritise targets for surveillance, questioning, or further investigation.
- Understand communication flow and identify critical points where disrupting connections can collapse the network.
PageRank and centrality measures are essential tools for analysing CDR data, as they highlight key players, communication hubs, and network structures. By visualising these insights in a graph-native tool like GraphAware Hume, investigators can quickly uncover critical relationships, prioritise nodes for investigation, and describe the full scope of a communication network with clarity and precision.

High-Risk nodes and behavioural analysis
In Call Detail Records analysis, identifying and prioritising high-risk nodes—individuals or entities exhibiting suspicious or abnormal behaviours—is critical for effective investigations. By leveraging graph analytics and behavioural analysis, investigators can surface anomalies, detect influential nodes, and uncover hidden patterns in communication networks.
1. Identifying high-risk nodes
High-risk nodes are identified based on behavioural deviations and their structural roles in the network. Investigators can use advanced analytics to detect:
- Anomalies: Unusual communication patterns, such as sudden spikes in call frequency, odd call durations, or communications at irregular hours.
- Outliers: Nodes that connect to otherwise isolated groups or exhibit behaviour inconsistent with others in the network.
- Brokers: Nodes that act as intermediaries between disconnected groups, facilitating the flow of information.
Key techniques:
- Degree analysis: Identify nodes with unusually high or low connections.
- Temporal analysis: Highlight irregular call patterns (e.g., nighttime calls or bursts of activity).
- Behavioural comparison: Compare node behaviour to the baseline network activity to detect deviations.
2. Prioritising targets
Once high-risk nodes are identified, investigators can prioritise them based on their role, behaviour, and significance in the network:
- Central hubs: Nodes with the most connections or influence (e.g., leaders or coordinators).
- Anomalous nodes: Individuals whose activity deviates from the norm (e.g., irregular calls or connections to new, suspicious entities).
- Intermediaries: Brokers or bridges connecting disparate parts of the network, whose removal can disrupt communication flow.
3. Real-world scenarios
Scenario 1: Counter-terrorism investigation
A group of suspected extremists is under investigation, and CDR analysis reveals:
- High-risk node: A phone number (Node A) with sudden spikes in call activity to new, previously unrelated contacts during the lead-up to an attack.
- Behavioural insight: Temporal analysis shows late-night calls and communication bursts inconsistent with the rest of the group.
- Outcome: Investigators prioritise surveillance on Node A, uncovering the individual as a coordinator organising activities across different cells.
Scenario 2: Financial fraud network
A fraud ring is suspected of executing coordinated scams across multiple locations:
- High-risk node: A phone number (Node B) communicating with several disconnected entities, acting as a broker between groups executing the scam.
- Behavioural insight: The node has short-duration calls at regular intervals, suggesting structured and repetitive coordination.
- Outcome: Investigators focus on Node B, identifying them as the middleman who distributes instructions and connects different participants in the fraud.
Scenario 3: Human trafficking operation
In a human trafficking investigation, CDR analysis uncovers:
- High-risk node: A single phone number (Node C) appearing across multiple locations and frequenting calls with two known traffickers.
- Behavioural insight: Geospatial analysis shows Node C’s location aligning with drop-off points, while behavioural analysis detects calls during transit hours.
- Outcome: Node C is identified as a logistics coordinator, facilitating the movement of victims between regions.
4. Benefits of behavioural analysis in CDR investigations
Behavioural analysis combined with graph insights allows investigators to:
- Surface hidden threats: Identify nodes with abnormal behaviour that may otherwise remain unnoticed.
- Disrupt networks: Prioritise high-risk targets like coordinators or brokers whose removal can destabilise operations.
- Detect emerging patterns: Uncover new behaviours or entities entering a network, signalling potential threats.
Structural insights: Triangle nodes and network patterns
In Call Detail Records analysis, understanding the structural properties of a communication network can provide valuable insights into relationships, behaviours, and coordinated activities. By analysing network patterns—such as triangle nodes, clusters, and recurring motifs—investigators can uncover hidden connections, identify trusted relationships, and detect signs of organised or anomalous activity.
1. Triangle nodes: Identifying trusted relationships
A triangle node occurs when three entities (e.g., phone numbers) are all interconnected. This triadic closure is often indicative of strong, trusted relationships or coordinated activity within a group.
- Use case in CDR analysis:
- Investigators analysing a criminal network may find multiple triangle nodes among individuals frequently communicating with each other.
- For example, if Person A, Person B, and Person C all call one another regularly, it suggests a tightly knit subgroup—likely core members of an organisation, such as a leadership cell.
- Insights gained:
- – Core group detection: Triadic patterns highlight tightly bound entities, enabling investigators to focus on the most active or critical nodes.
- – Trust and collaboration: Triangles often indicate strong trust between individuals, common in organised crime, fraud rings, or corporate collusion.
2. Network patterns: Uncovering coordination and emerging threats
Network patterns, such as recurring motifs and clusters, reveal higher-level behaviours and organisational structures in CDR data.
- Key patterns to analyse:
- – Tightly knit clusters: Groups of interconnected nodes indicate coordinated teams, such as operational units or social circles.
- Example: In a drug trafficking case, a cluster of phone numbers communicating repeatedly at odd hours points to a distribution team.
- – Star patterns: A central node connected to multiple others may represent an influencer, broker, or communication hub.
- Example: A single phone number coordinating calls to ten other nodes might indicate a leader distributing instructions to subordinates.
- – Chains or paths: Linear paths of nodes represent communication relays, where intermediaries pass messages along a chain.
- Example: In human trafficking, intermediaries acting as “middlemen” relay instructions between coordinators and field operators.
- – Tightly knit clusters: Groups of interconnected nodes indicate coordinated teams, such as operational units or social circles.
- Benefits:
- – Detect hierarchies or information flow within a network.
- – Identify brokers whose removal would disrupt communications.
- – Surface outlier nodes—entities weakly connected to others but exhibiting unusual behaviour.
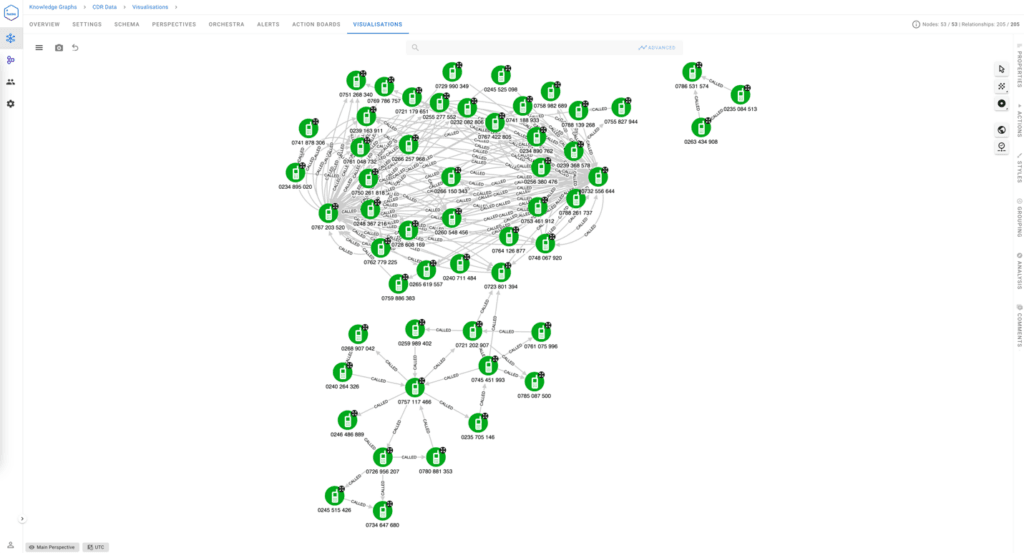
Figure 7 – Triangular Relationships
3. Motifs: Repeating patterns that signal systematic behaviour
Motifs are recurring subgraphs or patterns within a network. They often signal systematic workflows, repeated behaviours, or coordinated operations.
- Use case in CDR analysis:
- Detecting a repeating pattern where certain phone numbers exhibit a structured call order— e.g., Node A → Node B → Node C—at the same time daily.
- Such motifs may indicate:
- – Call relay mechanisms: To evade detection, individuals may use structured relays to pass messages.
- – Automated activity: Fraud schemes where scripted calls occur at regular intervals.
- Insights gained:
- – Highlight systematic behaviours that deviate from normal patterns.
- – Uncover sophisticated coordination in criminal operations.
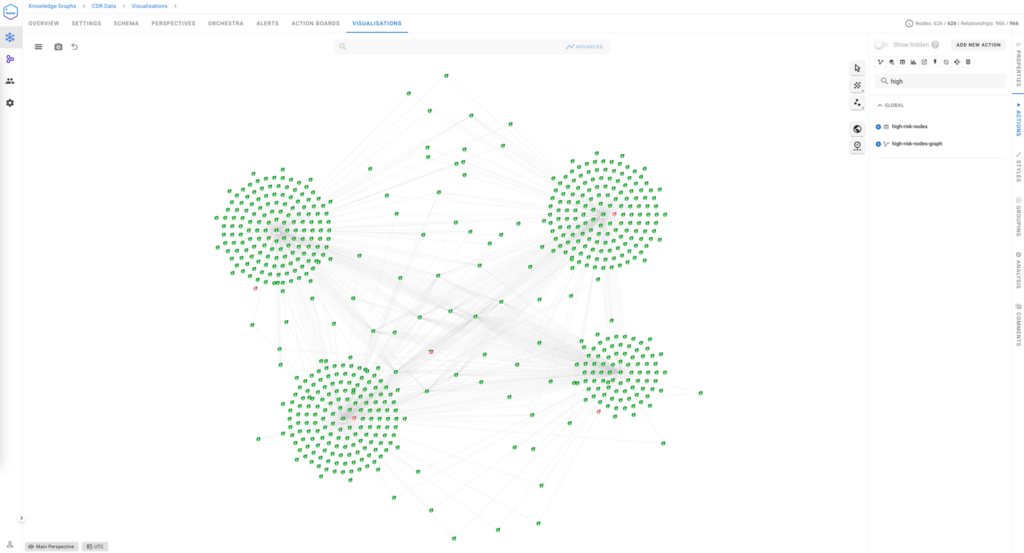
Figure 8 – Recurring network patterns
4. Structural analysis to detect anomalies
By examining structural properties, investigators can detect nodes that break expected patterns:
- – Missing connections: Gaps in an otherwise interconnected network may indicate deliberate isolation (e.g., lone actors or burner phones).
- – Outlier nodes: Nodes with unusual structural positions—like weakly connected entities suddenly linked to multiple clusters—can signal new or emerging threats.
Example: In a fraud investigation, a phone number previously inactive becomes highly connected to multiple nodes across different clusters, signalling a potential new operator entering the network.
5. Real-world scenarios
- Organised crime: Triangular relationships between three phone numbers reveal a trusted group coordinating activities. Identifying these core clusters enables law enforcement to prioritise surveillance on key players.
- Fraud detection: Star patterns highlight central figures who distribute instructions across the network, making them high-value targets for disruption.
- Terrorism investigations: Chains or relay patterns expose communication workflows between leaders and field operatives, helping analysts uncover hierarchies and disrupt operations.
Conclusion
Call Detail Records (CDRs) are a vital resource for uncovering communication patterns, identifying key players, and driving investigations across law enforcement, intelligence, and corporate sectors. However, the sheer scale, complexity, and interconnected nature of CDR data present significant challenges for traditional tools.
GraphAware Hume provides a transformative solution through its graph-native analytics, real-time processing, and seamless data enrichment capabilities. By leveraging advanced techniques such as community detection, PageRank and centrality analysis, and structural insights, Hume empowers analysts to reveal hidden relationships, detect anomalies, and prioritise high-risk targets efficiently.
Hume’s ability to integrate CDR data with external intelligence sources, normalise inconsistent formats, and visualise dynamic networks ensures that investigators can extract actionable intelligence with clarity and precision. Whether uncovering organised crime, fraud networks, or operational workflows, GraphAware Hume turns static CDR data into a living, connected narrative.In a world where timely, data-driven decisions can make all the difference, Hume equips investigative teams with the tools they need to connect the dots, uncover the truth, and act with confidence.

