
What is graph analytics?
Graph analytics is the process of analysing relationships within connected data to uncover patterns, identify influential entities, detect anomalies, and generate insights.
Unlike traditional analytics, which focuses primarily on individual records, graph analytics examines how entities are connected. By analysing relationships between people, organisations, locations, devices, events, and other entities, graph analytics helps organisations understand the structure and behaviour of complex networks.
Graph analytics is widely used in intelligence analysis, fraud detection, cybersecurity, financial crime investigations, and risk management because it can reveal patterns that are difficult to identify using traditional analytical approaches.
How does graph analytics work?
Graph analytics applies algorithms to connected data stored within a graph.
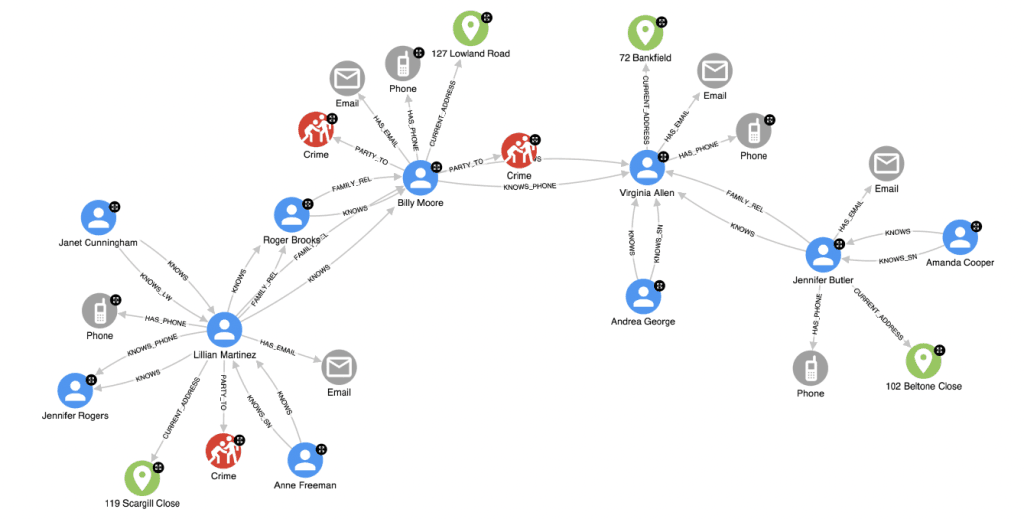
In a graph:
- Nodes represent entities such as people, organisations, accounts, devices, locations, or events.
- Relationships represent the connections between those entities.
- Properties provide additional context about entities and relationships.
Graph analytics algorithms analyse the structure of these connections to identify patterns, measure influence, detect communities, and uncover hidden relationships.
Rather than focusing solely on individual entities, graph analytics helps analysts understand how information is connected across an entire network.
Graph analytics vs traditional analytics
Traditional analytics focuses on records, attributes, and transactions.
For example, a spreadsheet may show a list of transactions between accounts, while a relational database can store large volumes of records and support reporting.
Graph analytics takes a different approach by focusing on relationships.
Instead of analysing transactions in isolation, graph analytics can reveal how multiple accounts, devices, businesses, locations, and individuals are connected through a wider network.
This makes graph analytics particularly effective for investigating complex scenarios where relationships matter as much as the underlying data itself.
Common graph analytics techniques
Graph analytics includes a range of algorithms designed to answer different types of questions about connected data.
Centrality analysis
Centrality algorithms identify the most important or influential entities within a network.
These algorithms help analysts answer questions such as:
- Who are the key actors in a criminal network?
- Which account is central to a fraud scheme?
- Which device acts as a bridge between multiple groups?
Common centrality measures include degree centrality, betweenness centrality, closeness centrality, and PageRank.
Community detection
Community detection identifies clusters of entities that are more strongly connected to one another than to the wider network.
This helps analysts uncover:
- Criminal groups
- Fraud rings
- Organised networks
- Groups of related customers
- Coordinated activity
Community detection is particularly valuable when investigating large and complex networks.
Similarity analysis
Similarity algorithms identify entities that share similar characteristics or connection patterns.
For example, analysts may use similarity analysis to:
- Identify accounts exhibiting similar behaviour
- Find entities with shared relationships
- Discover potentially related investigations
- Recommend similar entities for further review
Link prediction
Link prediction estimates the likelihood that two entities are connected, even when no direct relationship currently exists in the data.
This can help analysts:
- Identify hidden relationships
- Discover previously unknown connections
- Predict emerging networks
- Prioritise investigative leads
Path analysis
Path analysis explores how entities are connected through intermediate relationships.
For example, investigators may want to understand:
- How a suspect is connected to an organised crime group
- How funds move through a network of accounts
- How information spreads across a network
Path analysis helps analysts trace relationships across complex datasets and understand the wider context surrounding an investigation.
Why graph analytics matters
Many organisations collect vast amounts of data but struggle to understand how that information connects across systems and sources.
Important relationships often remain hidden within disconnected datasets, making investigations slower and increasing the risk of missed insights.
Graph analytics helps organisations:
- Reveal hidden relationships
- Identify influential entities
- Detect anomalies and suspicious behaviour
- Understand network structures
- Improve decision-making
- Accelerate investigations
By analysing relationships directly, graph analytics provides insights that are often difficult to obtain through traditional reporting and analytical techniques.
How GraphAware Hume uses graph analytics
GraphAware Hume combines graph analytics and graph visualisation to help analysts understand complex networks of people, organisations, locations, events, and assets.
Using GraphAware Hume, analysts can:
- Explore connected data visually
- Perform link analysis
- Investigate relationships across multiple data sources
- Analyse temporal and geospatial information
- Identify patterns and investigative leads
- Build a more complete operational picture
By combining connected data with graph-powered intelligence analysis, GraphAware Hume helps organisations move from fragmented information to connected intelligence.
See graph analytics in action
Graph analytics becomes most valuable when analysts can explore relationships, investigate networks, and generate insights within a single environment.
Watch the demonstration below to see how GraphAware Hume uses graph analytics to help analysts uncover hidden connections and support evidence-based decision-making.
FAQs
What is graph analytics?
Graph analytics is the process of analysing relationships within connected data to identify patterns, influential entities, communities, anomalies, and hidden connections.
What are graph algorithms?
Graph algorithms are mathematical techniques used to analyse connected data. Common graph algorithms include centrality analysis, community detection, similarity analysis, link prediction, and path analysis.
What is the difference between graph analytics and graph databases?
A graph database stores connected data using nodes and relationships. Graph analytics applies algorithms to that connected data to generate insights and identify patterns.
What is centrality analysis?
Centrality analysis identifies the most important or influential entities within a network based on their connections and position in the graph.
What is community detection?
Community detection identifies groups of entities that are more strongly connected to one another than to the rest of the network.
How is graph analytics used in intelligence analysis?
Intelligence teams use graph analytics to investigate networks, identify influential entities, uncover hidden relationships, analyse criminal activity, and generate investigative leads.
Does GraphAware Hume use graph analytics?
Yes. GraphAware Hume uses graph analytics to help analysts explore connected data, investigate relationships, identify patterns, and support graph-powered intelligence analysis.