Real-world intelligence analysis is messy.
Data comes from dozens of sources. Hypotheses evolve constantly as new information emerges. Multiple threads of investigation run in parallel. Analysts navigate complex networks of entities, files, and visualisations as they work to turn fragmented information into clear and timely insights.
GraphAware Hume was built to help analysts make sense of that complexity. And with GraphAware Hume 3.0, we’re taking that mission further by introducing a new foundation for analyst-led intelligence work.
Putting analysts at the heart of intelligence analysis
This release marks a major new chapter for the platform, and the first step toward a simple goal: putting analysts in control of their analysis.
It gives teams more flexibility over how their work is structured, managed, and shared, making graph-powered intelligence analysis simpler, more collaborative, and more effective.
GraphAware Hume 3.0 introduces new capabilities to help analysts safely navigate complex intelligence environments where data from many sources must be brought together into a single, connected view.
Read on to learn how GraphAware Hume 3.0 is built for the reality of intelligence work: complex, evolving, and driven by the analysts who need to make sense of it.
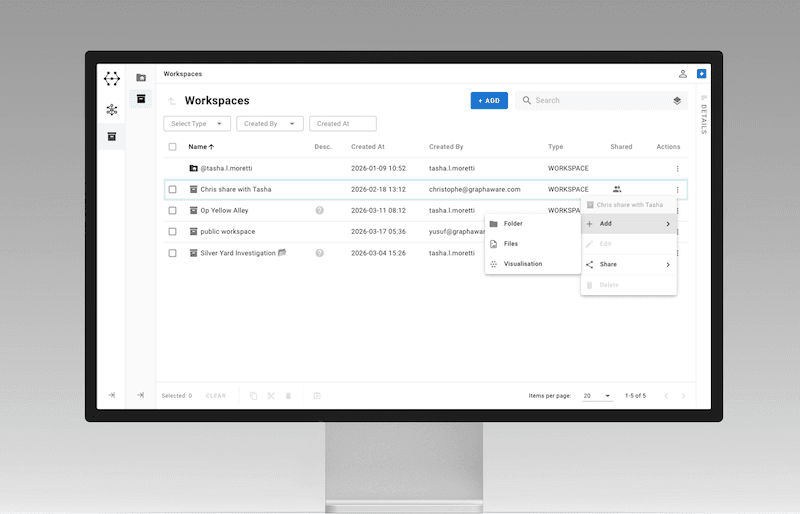
Workspaces: space to think, explore, and collaborate
GraphAware Hume 3.0 introduces Workspaces, a new way for analysts to structure and manage their work inside the platform.
Each Workspace is a clearly defined environment where analysts can organise their work intentionally and collaborate to make sense of complex connected data.
Inside a Workspace, analysts can:
- Structure their work in a way that makes sense to them
- Collaborate on projects, cases, and investigations with clear access control and permissions
- Separate parallel cases or lines of enquiry in a clear and intuitive way
- Share progress with their wider team without losing ownership
Workspaces allow analytical work to be organised without fragmenting it across disconnected assets. Analysts can store the files, visualisations, and snapshots related to a line of enquiry in one structured location.
As a result, analysts gain greater clarity, stronger ownership, and better control in complex, fast-moving environments.
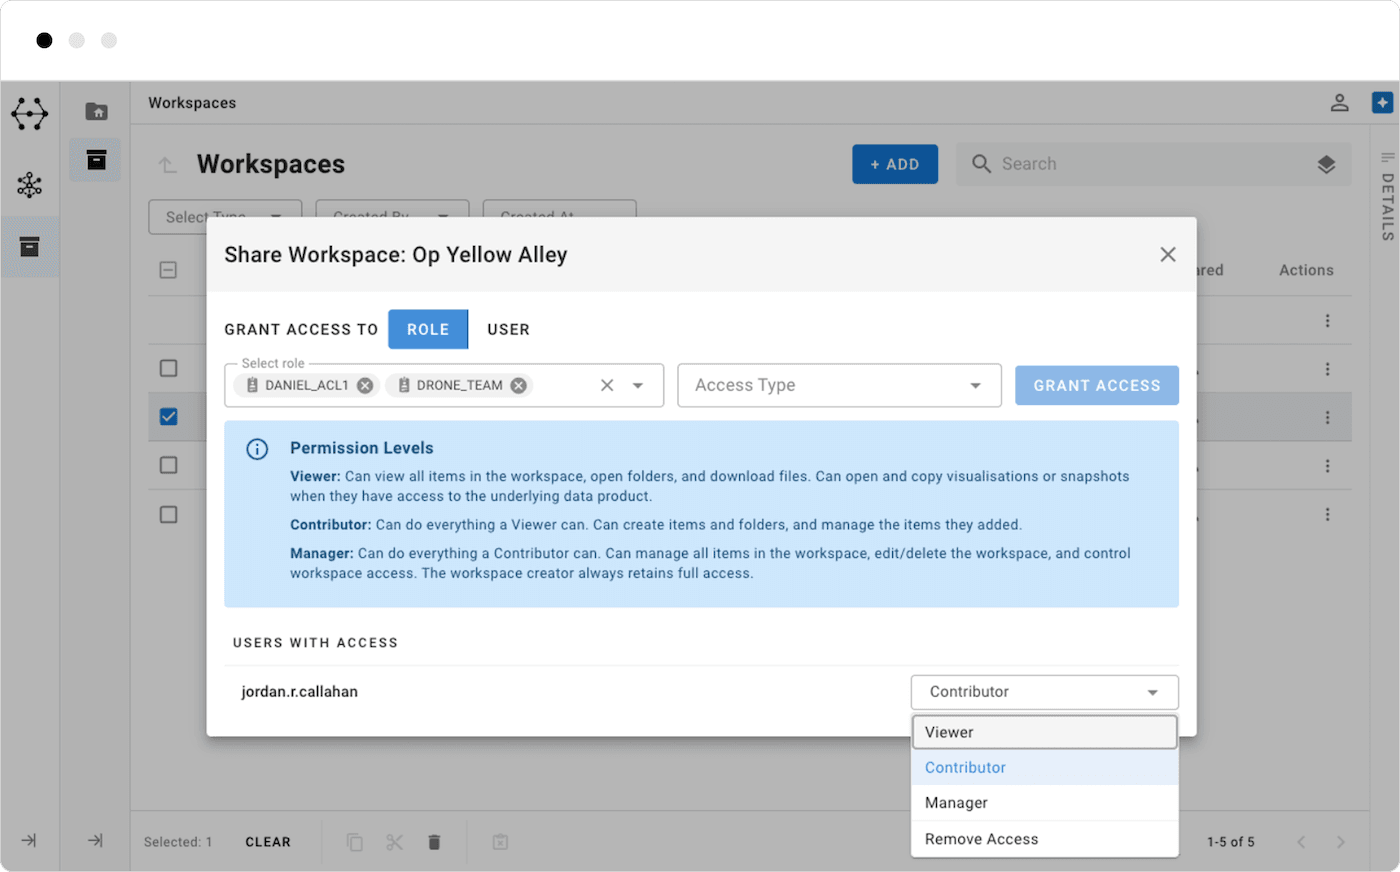
Collaboration without compromise
Intelligence work is inherently collaborative, but collaboration must be controlled and accountable.
Workspaces introduce structured access at the investigation level. Permissions are clearly defined so authorised users can view or contribute to a specific Workspace, visualisation or file. Activity within each Workspace is logged and auditable, providing visibility into how investigative work develops and how access changes over time.
This structure ensures collaboration remains auditable and accountable. Analysts can work together effectively while maintaining clear ownership of their investigative outputs.
Managing multi-source complexity at scale
GraphAware Hume allows organisations to unify their data from multiple sources into a connected view of intelligence. Each new data source may introduce new entities, terminology, and complexity to the graph schema.
As these environments grow, managing the schema can become increasingly difficult. Teams need to understand where data originates, how entities relate across sources, and how changes to the schema might affect their analytical workflows.
GraphAware Hume 3.0 introduces two important improvements that help teams manage this complexity with confidence.
Get a clearer view of your data sources
GraphAware Hume’s schema view shows how your underlying graph is structured. It gives developers and analysts a clear picture of the entities (or schema classes) and the relationships between them, making it easier to understand how different datasets connect, and how data can be queried. But, as the graph grows, the schema becomes more complicated.
GraphAware Hume 3.0 introduces a new approach to help manage this complexity.
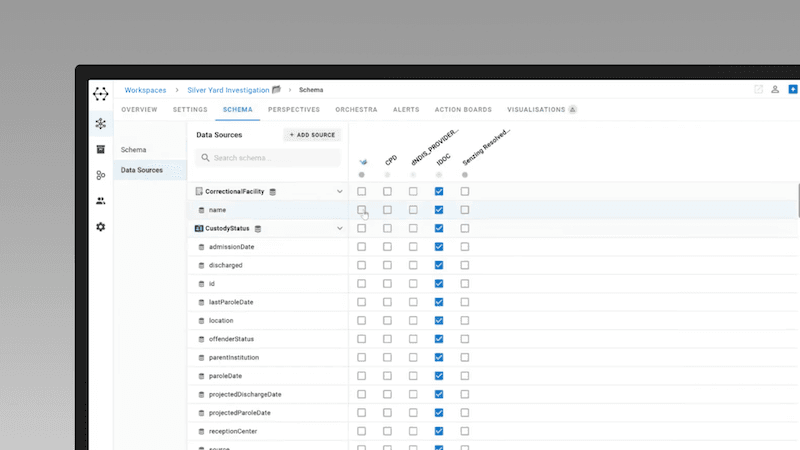
Developers can now partition schema classes, relationships, and attributes by their originating data source. This makes it easier to understand how different datasets contribute to the wider intelligence picture.
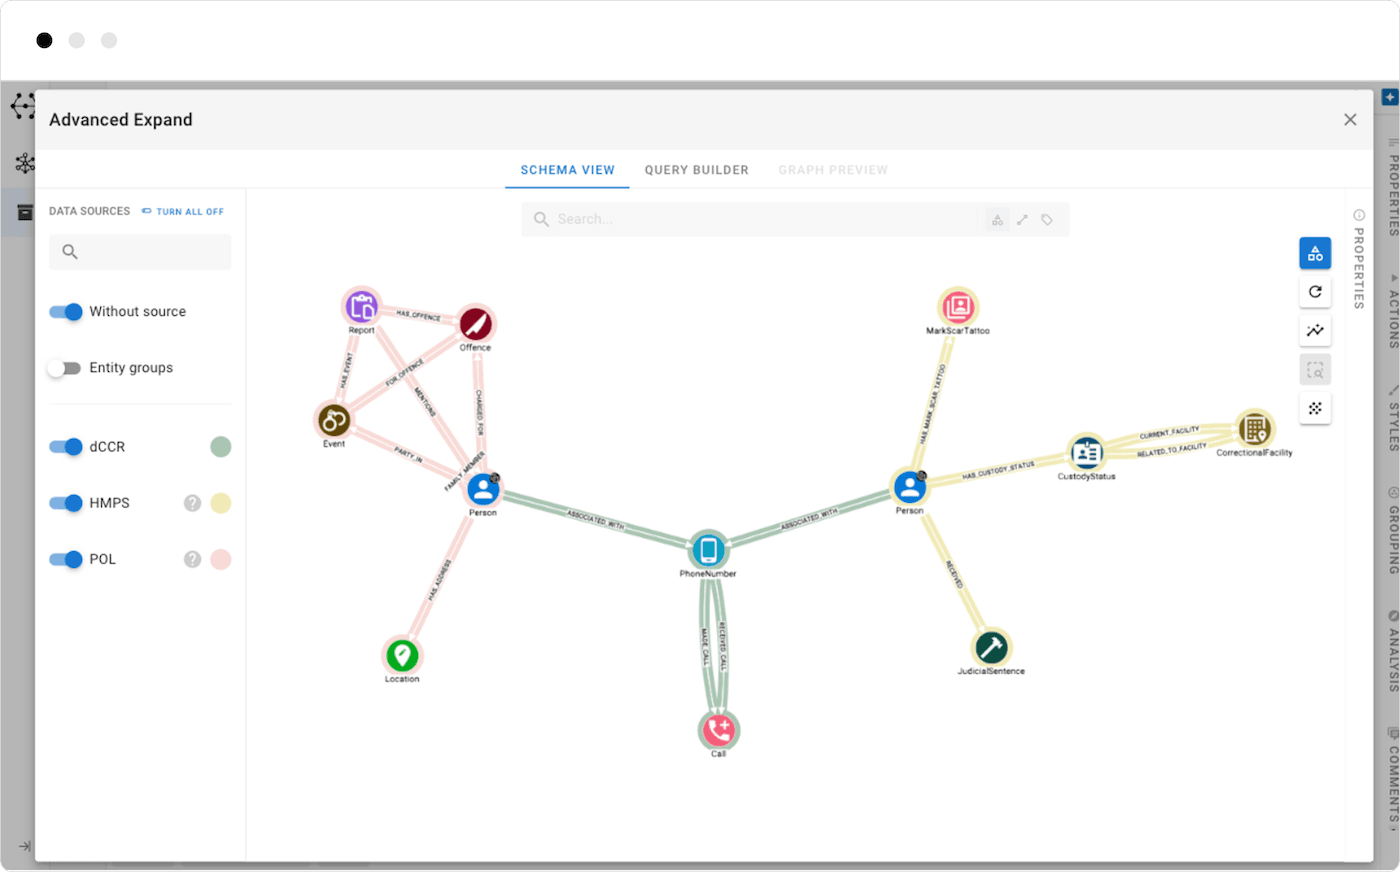
This data source information is available to both developers and analysts in the schema view, making it easier to see how new data sources fit into the existing model and to determine how best to query the graph.
Effortlessly navigate entity-resolved graphs
When data from multiple systems is combined, the same real-world entity often appears more than once. A person, organisation, or location may exist in several datasets, each represented by a separate node in the graph.
Rather than merging those records into a single node and losing important context, GraphAware Hume uses entity groups to connect records that likely represent the same real-world entity while preserving their source data. This allows analysts to understand relationships across sources while still maintaining provenance, data separation, and access control.
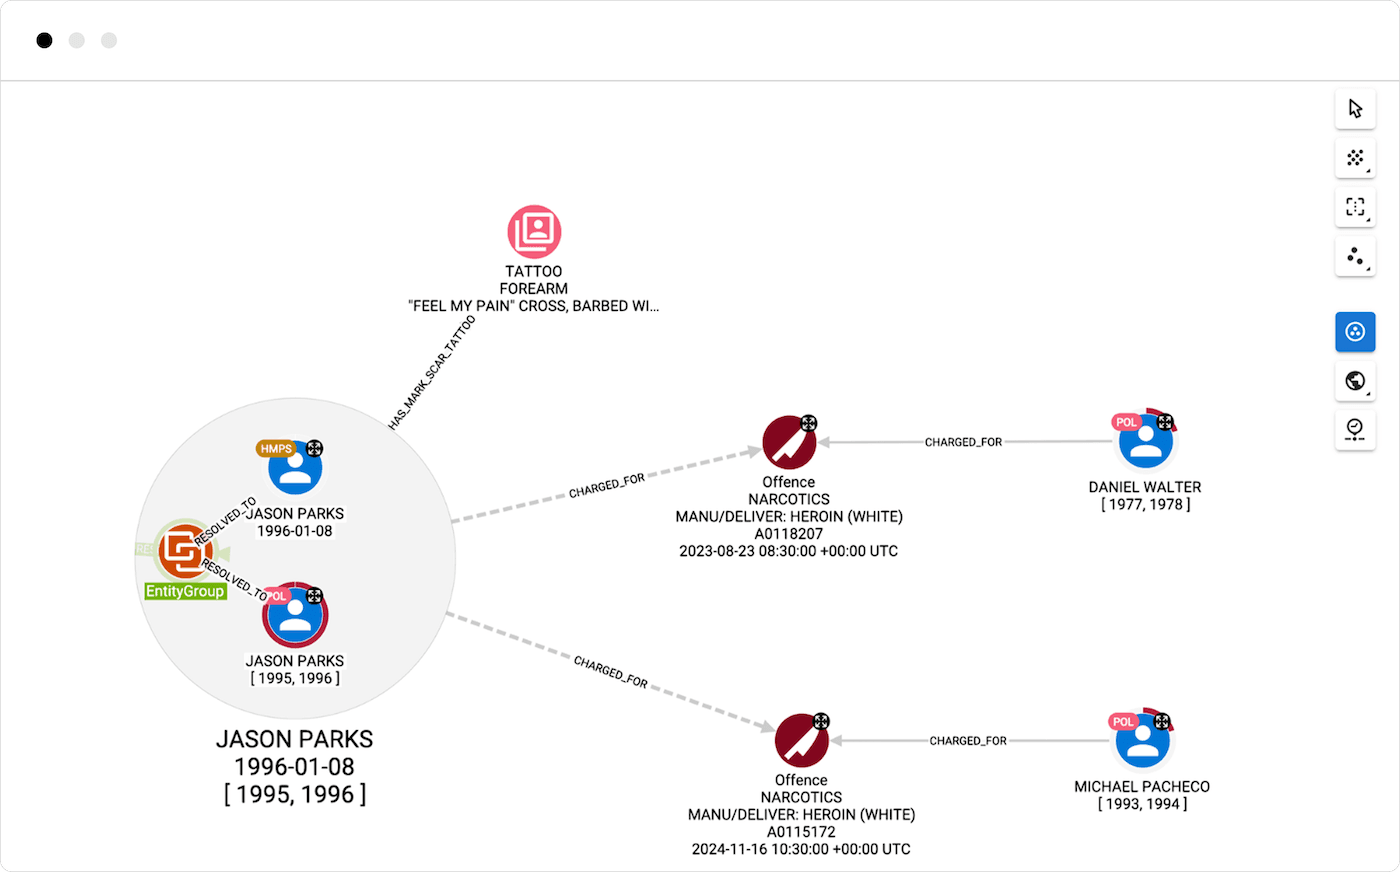
In previous versions of GraphAware Hume, analysts needed to be aware of these entity groups when building queries or performing advanced expands, adding an extra layer of complexity to investigative workflows.
In GraphAware Hume 3.0, that complexity has been removed.
Analysts can query and explore their data as if they were working with a single entity, without needing to manage the underlying entity resolution logic.
The result is a simpler, more intuitive analytical experience while still preserving the flexibility, security, and data transparency required for graph-powered intelligence analysis.
Additional improvements throughout the platform
Alongside Workspaces and improvements to schema and entity handling, GraphAware Hume 3.0 also introduces enhancements that strengthen platform performance and operational reliability. These include:
Support for multiple base maps
You can now configure multiple geospatial base maps, including vector and raster maps. Analysts can switch between map styles on the fly, choosing the view that best supports their analysis.
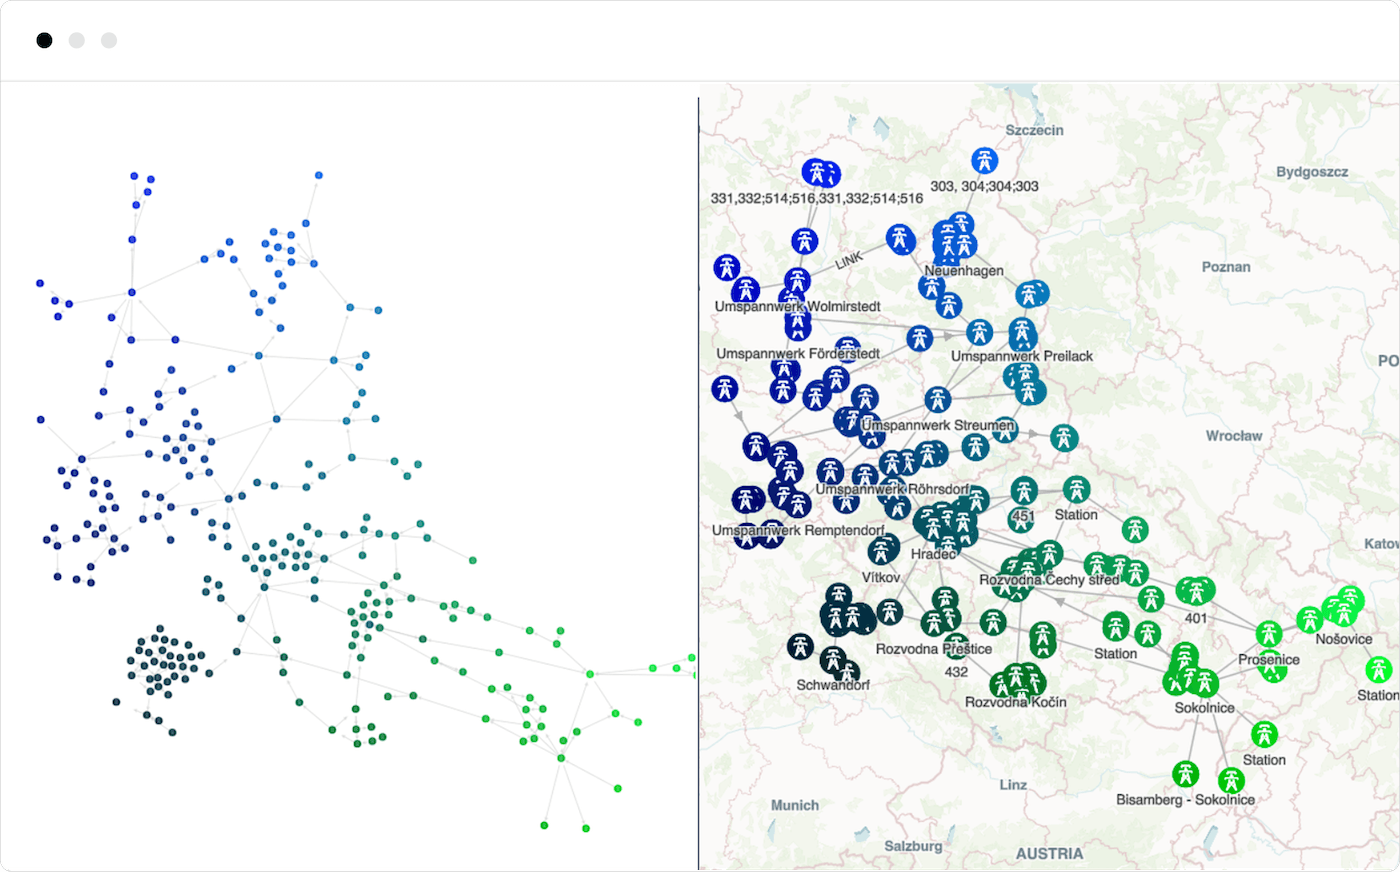
Geo-influenced graph layout
We’ve introduced a geo-influenced graph layout that incorporates nodes’ geospatial locations into their force-directed positioning. This keeps graph and map views aligned, making it easier to connect network structure with real-world geography.
Improved clustered node visibility
We’ve improved the way geolocated nodes are displayed in dense map views, so that tightly clustered data remains clear and readable. Labels stay visible, and overlapping is reduced, making complex geospatial analysis easier to work with.
Fine-tuned layouts
New layout controls allow analysts to fine-tune their graph visualisations with precision. They can align, arrange, and distribute nodes into structured grids and rows. Layout density and orientation can be adjusted to create clearer, more readable visualisations.
Hume Orchestra event logging
We’ve improved how events are stored and managed in Hume Orchestra, enabling more efficient and reliable pipeline execution with stable resource usage over time.
Support for the latest Neo4j platform
GraphAware Hume 3.0 aligns with the latest Neo4j releases, supporting Neo4j 5 and newer versions, including Neo4j 2025 and Neo4j 2026. This ensures customers can take advantage of the latest platform capabilities while maintaining long-term support.
Ready to explore GraphAware Hume 3.0?
GraphAware Hume 3.0 marks an important step in the platform’s evolution. It introduces structured investigative environments while strengthening how organisations manage complex intelligence data.
Most importantly, it begins a broader shift towards analyst-led workflows within GraphAware Hume.
And this is just the beginning.
If you would like to see Workspaces in action and explore the full capabilities of GraphAware Hume 3.0, request a tailored demonstration from our team or catch our on-demand webinar.