
What is graph visualisation?
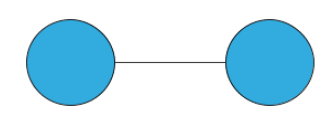
Graph visualisation is the visual representation of entities and the relationships between them.
In a graph visualisation, nodes represent entities such as people, organisations, devices, locations, accounts, or events. Relationships show how those entities are connected, such as ownership, communication, financial transactions, shared addresses, or co-occurrence.
For intelligence analysts, the value of graph visualisation is not simply that it makes data easier to look at. It provides a way to explore relationships directly, revealing structures and connections that can be difficult to understand when information is spread across tables, reports, or separate systems.
A graph visualisation might show a suspect connected to a phone, a phone connected to several other people, and those people connected to companies, vehicles, addresses, or previous investigations. Seeing those relationships together can change the questions an analyst asks and provide new directions for an investigation.
Why does graph visualisation matter in investigations?
Investigations often involve more information than an analyst can reasonably examine one record at a time.
A single investigation might contain communications data, financial transactions, company records, case histories, documents, geospatial information, and information from external sources. The challenge isn’t necessarily finding another record. It is understanding how the records relate to one another.
Graph visualisation provides a shared view of those relationships.
For example, an analyst investigating a suspected money laundering network might begin with a company and expand through its directors, shareholders, related businesses, bank accounts, and transactions. A visual representation can make it easier to see that several apparently separate entities are connected through the same individual, address, or intermediary company.
The visualisation does not determine what those relationships mean, but gives the analyst a clearer structure within which to assess them.

Graph visualisation is not the same as link analysis
Graph visualisation and link analysis are closely related, but they are not interchangeable.
Graph visualisation is a way of representing connected information so that analysts can explore and understand it.
Link analysis is an analytical technique used to examine relationships between entities, identify patterns, and generate investigative insights.
An analyst may use graph visualisation to perform link analysis, but link analysis can also be carried out using other representations and analytical methods.
In practice, the two work together. Visualisation gives the analyst a way to see and navigate relationships, while link analysis provides a structured approach to interpreting them.
Graph visualisation is not the same as graph analytics
Graph analytics uses algorithms to analyse the structure of a graph.
For example, a centrality algorithm might identify an entity occupying a strategically important position within a network, while a community detection algorithm might identify a tightly connected group.
Graph visualisation can then make those results easier to interpret.
An analyst might use an algorithm to identify a potential cluster within a large criminal network, then visualise that cluster to understand which people, locations, organisations, and events make it significant.
In this sense, visualisation and graph analytics are complementary:
Graph analytics can identify patterns. Graph visualisation helps analysts investigate and interpret them.
How analysts use graph visualisation
Graph visualisation can support different stages of an investigation, from initial exploration through to communicating findings.
Exploring relationships
Visualisation allows analysts to start with a known entity and follow its relationships through the graph.
A phone number might lead to a person. That person might be connected to a vehicle, an address, a company, and several other people. Expanding those relationships can reveal connections that would be difficult to identify by searching individual systems.
This is particularly useful when analysts do not yet know exactly what they are looking for.
Testing hypotheses
Visualisation can also be used to test investigative hypotheses.
An analyst may suspect that several incidents are linked to the same group. By bringing the relevant people, locations, devices, and events into the same view, they can examine whether the expected relationships actually exist.
This supports an investigative process based on evidence rather than assumptions.
Identifying patterns and anomalies
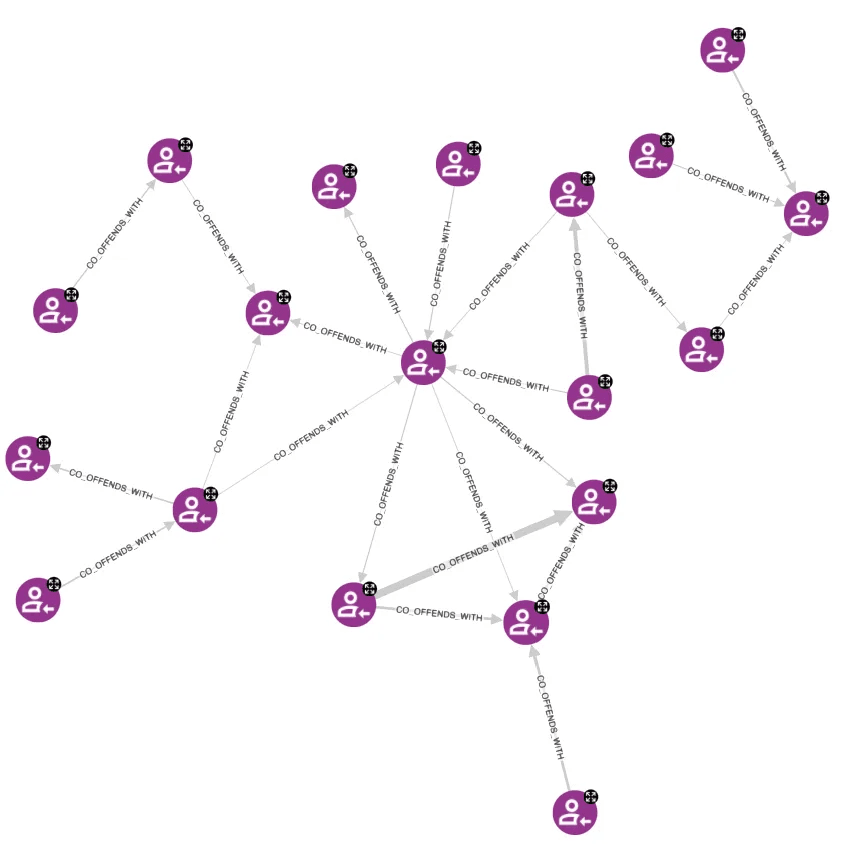
Some patterns become much easier to recognise visually.
These might include:
- A small number of individuals connecting several otherwise separate groups
- Several companies sharing the same directors or addresses
- Repeated communications between the same people
- Unusual concentrations of activity around a location
- Complex ownership structures involving multiple intermediary entities
Visualisation does not prove that a pattern is significant, but it can make something worthy of investigation visible.
Understanding algorithmic results
The output of graph algorithms can be difficult to interpret when presented as a table of scores.
Visualising those results can provide much more context.
For example, centrality scores can be used to resize or highlight nodes so that potentially important entities stand out within a network. Community detection results can be used to group or colour clusters, helping analysts understand how a network is structured.
Communicating findings
Graph visualisation can also help analysts explain complex relationships to colleagues, investigators, decision-makers, or other stakeholders.
A visual representation can show how entities are connected, where evidence sits within a wider network, and why a particular relationship or pattern matters.
This can be particularly valuable when an investigation involves complex ownership, financial flows, communications networks, or links between multiple cases.
Why context matters in graph visualisation
Showing more data doesn’t necessarily produce a better visualisation.
In a large investigation, displaying every available entity and relationship can quickly create a dense network that is difficult to interpret. The goal isn’t to show everything at once. It’s to show enough context to answer the question the analyst is trying to investigate.
Effective graph visualisation therefore depends on selecting the right information at the right level of detail.
Filtering can remove irrelevant entities. Grouping can simplify complex structures. Expanding can reveal additional context when needed. Different layouts can emphasise different aspects of the graph.
This is why interaction is such an important part of graph visualisation.
Rather than presenting one fixed picture, an investigative visualisation should allow the analyst to move between overview and detail as their understanding develops.
Making graph visualisations useful for investigations
Managing complexity
Large, highly connected investigations can quickly become difficult to interpret when too many entities and relationships are displayed together. Analysts need ways to focus on the information relevant to the question while retaining enough surrounding context to understand why a relationship matters.
Keeping important entities visible
Highly connected entities can dominate a graph, particularly in large investigations. Analysts need to be able to distinguish significant relationships from background connections and focus attention on the parts of the network that warrant further investigation.
Preserving context while filtering
Filtering and focusing a graph can make an investigation easier to understand, but removing too much information can also hide relationships that are important to the wider picture. The challenge is to reduce noise without losing investigative context.
Moving between overview and detail
Investigations rarely begin with a precisely defined answer. Analysts may start with a broad view, identify something interesting, then expand into the relevant people, organisations, events or relationships.
Graph visualisation is most useful when it supports that process, allowing analysts to move from an overview to focused detail as their understanding develops.
How GraphAware Hume supports graph visualisation
GraphAware Hume gives analysts a visual environment for exploring relationships across connected intelligence.
Rather than requiring analysts to work directly with the underlying graph database, GraphAware Hume lets them interact with the information visually as part of an investigation.
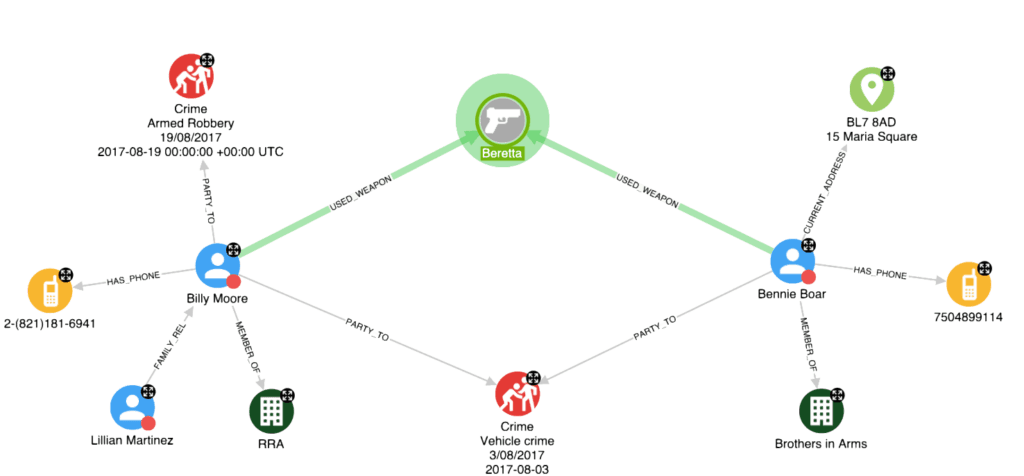
Analysts can use graph visualisation to:
- Explore relationships between people, organisations, devices, locations, and events
- Expand from known entities to discover additional connections
- Filter and focus investigations on relevant information
- Explore graph analytics results in context
- Combine graph visualisation with temporal and geospatial analysis
- Work collaboratively around a shared investigative picture
This allows visualisation to become part of the investigative workflow rather than simply an endpoint for presenting results.
The analyst remains responsible for interpreting the evidence, testing hypotheses, and deciding what matters. GraphAware Hume provides the environment in which that reasoning can take place.
FAQs
What is graph visualisation?
Graph visualisation is the visual representation of entities and the relationships between them. It allows analysts to explore connected information and understand patterns, structures, and relationships within a graph.
What is graph visualisation used for?
Graph visualisation is used to explore relationships, test investigative hypotheses, identify patterns, understand algorithmic results, and communicate complex findings. It is particularly useful in intelligence analysis, law enforcement, financial crime, cybersecurity, and investigations involving highly connected data.
What is the difference between graph visualisation and link analysis?
Graph visualisation is a way of representing connected information. Link analysis is an analytical technique used to examine relationships and identify patterns within that information. Analysts often use graph visualisation as part of link analysis.
What is the difference between graph visualisation and graph analytics?
Graph visualisation helps analysts see and explore relationships. Graph analytics applies algorithms to those relationships to measure, group, rank, or predict patterns within the graph. The two approaches are complementary.
Why is graph visualisation useful for intelligence analysis?
Intelligence investigations often involve large amounts of interconnected information. Graph visualisation provides a way to explore those relationships in context, making it easier to identify potential patterns, test hypotheses, and understand how different entities and events relate to one another.
What makes an effective graph visualisation?
An effective graph visualisation provides enough context to support investigation without overwhelming the analyst. Filtering, grouping, appropriate layouts, and interactive exploration all help analysts move between an overview of the network and the details that matter to a particular question.