Network analysis software: features and benefits

Explore the leading network analysis platform,
and uncover key features that help teams visualise relationships,
detect patterns, and analyse complex network data.

This comprehensive guide aims to help crime analysts understand the value of network analysis software, even if they have no prior experience with graph-native solutions.

Understanding relationships between entities is crucial for effective decision-making. This involves identifying direct interactions and uncovering hidden patterns that influence outcomes.

Network analysis is the process of mapping and analysing complex relationships in data. Through graph theory, centrality measures, and community detection, it reveals insights into dependencies, influence, and structural dynamics. Organisations use these insights to make better decisions, optimise their strategies, and predict trends more accurately.

Network analysis is a powerful technique for evaluating relationships between entities in large datasets. It’s essential in crime analysis and forensic accounting, where uncovering hidden connections often leads to significant breakthroughs.

GraphAware provides connected data analytics solutions for law enforcement and intelligence agencies, revolutionising how data is analysed and interpreted in these critical fields.

Network analysis software is a specialised tool used to analyse and visualise relationships between entities in large datasets. At its core, network analysis evaluates the connections between entities, allowing analysts to identify patterns, trends, and anomalies that might not be apparent through traditional analysis methods.

In network analysis, entities are represented as nodes, while the relationships between them are depicted as links or edges. These nodes can represent a wide range of entities such as people, organisations, events, or transactions.

The visual representation of data through networks is crucial, as it allows analysts to intuitively grasp complex relationships and uncover hidden connections.

Network analysis software represents data as a network of nodes and edges, ready for analysts to explore as they search for hidden connections and complex relationships.

The process typically involves several steps:

  • Data Ingestion: Collecting and importing data from various sources.
  • Data Representation: Mapping entities to nodes and relationships to edges.
  • Visualisation: Creating visual representations of the network to identify patterns.
  • Analysis: Applying algorithms and queries to uncover insights.

Graph databases like Neo4j are often used in network analysis due to their ability to efficiently store and query complex interconnected data.

Traditional network analysis typically relies on table-based data models. As relationships become more complex, these approaches can struggle with performance and make it difficult to explore connections beyond a few hops.

Graph technology addresses these limitations by storing relationships as first-class citizens. This enables efficient multi-hop traversal, flexible schema evolution, and straightforward integration of additional data sources.

Computational complexity

In real-world scenarios, network analysis often involves gigabytes of interconnected data. Traversing even a few levels using repeated table joins across large datasets can quickly become computationally expensive and memory-intensive.

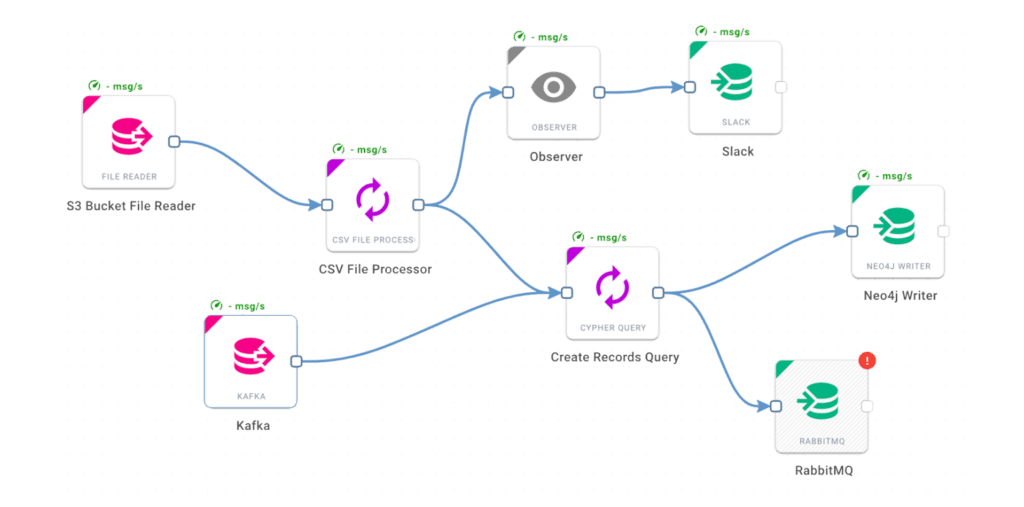
GraphAware’s link analysis architecture uses native graph queries to traverse relationships directly, following multi-step connections as a single logical operation. Because relationships are stored explicitly, traversal performance is driven by the local connectivity of the graph rather than the size of the overall dataset, enabling consistent performance even as network complexity and depth increase.

Lack of persisted relationships

Analysts are frequently required to answer time-based questions, such as determining who owned an asset at a specific point in time. Supporting this requires temporal data that records when relationships started and ended.

In relational systems, where relationships are not stored as first-class entities, answering new temporal questions often means writing additional queries and reconstructing ownership chains through repeated joins.

In contrast, GraphAware’s link analysis software stores both nodes and relationships with their own properties, including attributes such as start and end dates. Introducing a temporal dimension typically requires only adding a time-based condition to the traversal query, rather than rebuilding the logic from scratch.

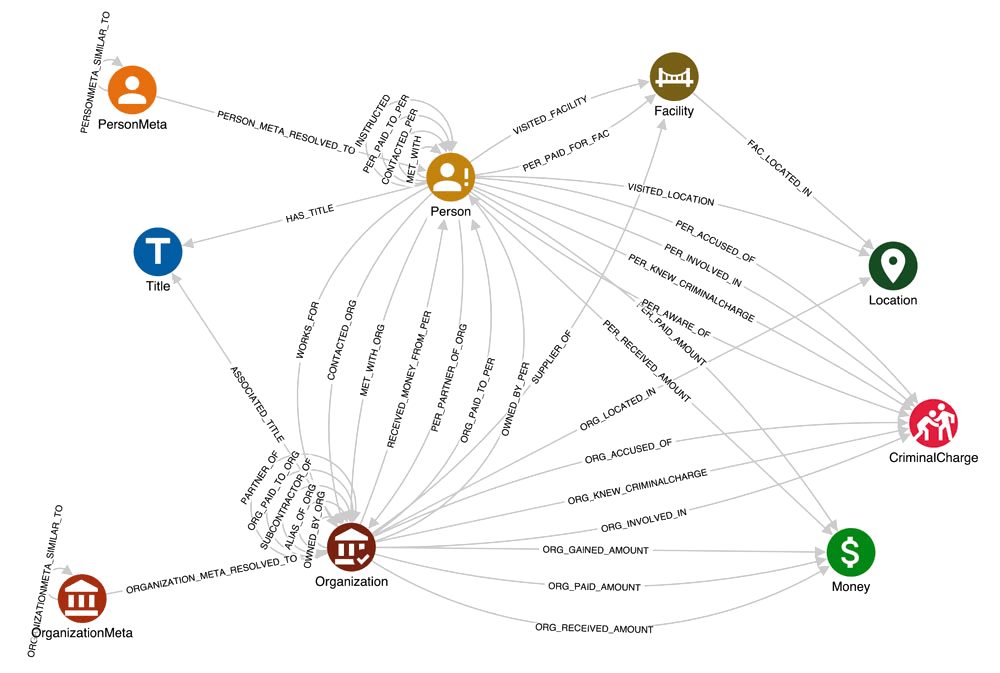
The graph model also enables flexible exploration. New data sources — such as transaction records or regulatory filings — can be incorporated into the existing graph structure without schema disruption. This allows investigators to uncover emerging patterns and connections as the network evolves.

Traditional, table-based software Graph-powered software
Computational complexityHigh – grows with dataset sizeLow – scales efficiently with data volume
RelationshipsMust be recomputed for each queryPersisted and instantly accessible
FlexibilityRigid schema – adding data increases complexityFlexible schema – new data slots into the network instantly

Data ingestion

Effective network analysis begins with seamless data ingestion. To establish meaningful links between entities, data from various sources must be connected first. Tools like Hume Orchestra streamline the data ingestion process by enabling documentation and integration of multiple data streams, ensuring that all relevant information is available for analysis.

Scalable data workflow engine
A data ingestion workflow in GraphAware Hume’s Orchestra tool

Graph visualization

Graph visualization is a cornerstone of network analysis software, allowing analysts to identify patterns and connections quickly. Visual interfaces transform complex data into intuitive graphs and charts, making it easier to detect relationships and anomalies.

graph visualisation
Graph visualization

Data integration and enrichment

Network analysis software excels in connecting disparate data sources, both structured and unstructured.

Structured data sources may include databases and spreadsheets, while unstructured sources encompass text documents, social media, and more. Data normalisation and resolving inconsistencies are critical steps, often achieved through entity resolution algorithms within graph databases.

Enriching data with external intelligence sources provides a comprehensive view of the analysed entities, creating a single source of truth. This capability ensures that all relevant information is considered, enhancing the accuracy and depth of the analysis.

Data analytics platform for criminal investigation
Knowledge graph schema for criminal investigation

Analytical capabilities

Advanced analytical capabilities are essential for deriving meaningful insights from network data. Key features include:

  • Multihop connections and shortest path: Identify the shortest path between entities, revealing direct and indirect relationships that are impossible to detect with traditional software.
  • Maps and time bars: Visual tools that display geospatial and temporal data, providing context to the relationships and events.
  • Community detection algorithms: Identify clusters and communities within the network, such as organised crime groups.
  • Centrality analysis: Determine the importance of nodes within the network, helping to identify key players.

These analytical tools enable the execution of complex queries across vast amounts of data, uncovering patterns and connections that drive actionable intelligence.

A co-offending network analysis
Using centrality measure to highlight the relative importance of nodes in a network

Reporting and collaboration

Effective reporting and collaboration features are vital for crime analysts working in teams. Network analysis software offers capabilities such as:

  • Saving, sharing, and retrieving link charts: Easily share visualisations with team members for collaborative analysis.
  • Automated alerting: Receive notifications for patterns of interest, ensuring timely responses to emerging threats.
  • Report and dashboard generation: Create comprehensive reports and dashboards that summarise key findings and insights.

These features facilitate efficient teamwork and ensure that critical information is communicated effectively across the organisation.

reporting
Reporting and collaboration in GraphAware Hume
data orchestration

Improved investigative efficiency

Network analysis software improves investigative efficiency by accelerating insight generation and supporting more informed resource allocation. Analysts can explore interconnected data sources to identify relationships between entities that would be difficult to uncover using manual or fragmented approaches.

By integrating organisational data into a unified knowledge graph, investigators gain a structured, queryable view of complex networks. This supports both analytical exploration and visual investigation, helping teams move from disconnected data points to actionable intelligence more quickly.

native graph analysis

Enhanced pattern identification

A key strength of network analysis is its ability to reveal hidden patterns and connections between crimes, individuals, and organisations. Algorithms such as shortest path and PageRank help investigators identify critical intermediaries, influential actors, and non-obvious links within complex networks.

Beyond structural analysis, graph-based investigation supports timeline exploration, recurring relationship patterns, geospatial connections, and financial transaction flows. By combining these perspectives within a single analytical environment, investigators can detect coordinated activity, emerging trends, and high-risk entities more effectively.

augmented intelligence

Predictive analysis

Beyond identifying existing patterns, network analysis can support predictive and risk-based analysis. By examining historical network structures and evolving relationships, analysts can identify indicators associated with elevated risk or emerging activity.

Rather than predicting specific crimes, graph-based models highlight entities, connections, or behaviours that resemble previously observed patterns. This enables earlier intervention, prioritised investigation, and more proactive risk mitigation.

icon chat

Intelligence sharing

Network analysis tools support intelligence sharing across teams and agencies by providing a consistent, relationship-centric view of data. A shared graph model helps unify disparate sources, enabling a more holistic understanding of entities, events, and their connections.

Because graph visualisations reflect how investigators naturally think about relationships, insights are easier to interpret across technical and non-technical roles. This broader accessibility allows frontline officers and operational teams to benefit from advanced analytical capabilities, while still relying on specialist analysts for deeper investigation and model design.

Explore GraphAware Hume

Conclusion

Network analysis software provides significant advantages for crime analysts and forensic accountants. By structuring and visualising complex relationships across large datasets, it enables more efficient investigations, deeper pattern detection, and risk-informed analysis. Analysts can move beyond isolated records to uncover hidden connections and generate actionable intelligence.

GraphAware’s Hume is designed to integrate fragmented data into a unified, graph-native environment, with advanced analytical capabilities and purpose-built investigative workflows.

As data volumes and network complexity continue to grow, adopting graph-based analysis is becoming increasingly important for organisations tackling crime and financial fraud. For investigative teams seeking to modernise their analytical capabilities, GraphAware provides a scalable and intelligence-led approach to connected data.

Book your live demo

Schedule a live walkthrough with
one of our specialists

Request a demo