So far, we have learned about collaborative filtering, content-based, and session-based recommendations. None of these approaches takes the situational context under consideration. Factors such as mood, occasion, location, company, etc., can affect user preferences and needs. Context-aware recommendations take these conditions into account to provide more relevant recommendations.
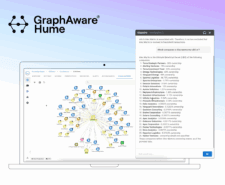
Graph visualisation is just what it sounds like - a visual representation of your data as a graph. A graph is a structure of objects that are connected. Thus graph visualisation is the visualisation of entities (nodes), and relationships among them.
Graph-Powered Machine Learning has already introduced us to content-based recommendations and collaborative filtering. These are the two most used approaches to providing recommendations. However, they both need information about the users to do so. What if you do not have user information? That’s where session-based recommendations come in.
Welcome back to the Graph-Powered Machine Learning book club. Now we are in the section of the book that focuses on recommendations. In the last blog, I summed up how content-based recommendations work. In the fifth chapter, the author Alessandro Negro introduces us to collaborative filtering.
So far, the Graph-Powered Machine Learning book has introduced us to graphs and machine learning. The second part of the book talks about recommendations. Recommender systems (RS) gather information about users and items and provide item suggestions, bringing great value to online stores - clothing stores, bookstores, you name it. Companies like Netflix base their entire businesses on high performing recommender systems.
What have we learned from Graph-Powered Machine Learning so far?
Welcome back to the Graph-Powered Machine Learning book club. As you know by now, Graph-Powered Machine Learning is a book written by our very own Dr. Alessandro Negro. The book is a must-read for all data scientists, but it’s also a great read for everyone interested in graphs. In this blog series, I summarise the key points of each chapter and provide some more explanations useful for us less technically savvy. We learned the basics about machine learning, graphs, and why the two are a great fit in the first chapter.
There are a multitude of databases to choose from when deciding how to store your data. They differ in complexity, scalability, data modelling possibilities they offer, and application. Let’s walk through some of the most popular databases and their differences.
Graphs are a natural fit for investigative use cases. Whenever you want to analyse a situation containing people, objects, locations, and events (POLE), graphs emphasising relationships between objects are your natural companion.
As you know, our Chief Scientist, Dr. Alessandro Negro, recently published a book titled Graph-Powered Machine Learning. We are very proud of the Chief, and very excited about the book. We're even planning an event, where you'll be able to ask Alessandro anything about it!But what is really in the book? Let me share what the first chapter is about so you know what you're in for - a treat! The book opens with an introduction to Machine Learning and Graphs. The first chapter covers Machine Learning, some of the challenges of Machine Learning, Graphs, and the role Graphs play...
Welcome to the first blog in the business series of GraphAware blog! This series is designed for us non-techies out there. Personally, I was shocked when I found out how big and common knowledge graphs are and how often graph databases are used in today's world - and I had first heard of them just a couple of months ago. So, for people like me, for marketers and non-tech people in business, I'll try to open the door to the world of graphs, and their potential and take you through it step-by-step. It seems only appropriate that we start with...
Neo4j Desktop, part of the Neo4j Graph Platform, is a client application that installs on your desktop OS. It lets you get started quickly by downloading and installing the enterprise edition, and supported plugins. You can group related graphs and applications under a Project. You can also build single-page web applications that run within Neo4j Desktop and have access to these services provided by Neo4j Desktop. There are a number of apps available at https://install.graphapp.io/
There is one common performance issue our clients run into when trying their first Cypher queries on a dataset in Neo4j. When writing a query, be sure that it doesn’t match any cycles, or you can experience unpleasant surprises.
Dependencies, like graphs, are everywhere. Achieving a goal is rarely possible in a vacuum and requires collaboration between individuals and/or processes.Eliminating dependencies completely is unrealistic- they are a part of life- but they can be streamlined to improve efficiency and reduce friction.
Previous articleshave shown you how easy using Spring with Neo4j can be. Now the next release of Spring Data Neo4j (SDN), we are going to make this even easier!
Over the last few months, GraphAware, Neo4j, and Pivotal engineers have been workingon a ground-up reimplementation of Spring Data Neo4j (SDN) that is server-first and Cypher-centric. Today we are veryexcited to announce the first milestone of the new Spring Data project for Neo4j.
With MERGE set to replace CREATE UNIQUEat some time, the behavior of MERGE can sometimes be tricky to understand.
Efficient counting of relationships in Neo4j was the cornerstone of my Master Thesisand the reason the very first GraphAware Frameworkmodule called the Relationship Count Module was born. The improvements in Neo4j 2.1around dense nodes and the addition of getDegree(…) methods on the Node interface made me eager to do some benchmarking around relationship counts again.
In the last post of our “Neo4j Modelling for Beginners” series,we looked at bidirectional relationships. In this post, we compare the implications of qualifying relationships byusing different relationship types versus using relationship properties.
Transitioning from the relational world to the beautiful world of graphs requires a shift in thinking about data. Althoughgraphs are often much more intuitive than tables, there are certain mistakes peopletend to make when modelling their data as a graph for the first time. In this article, we look at one common sourceof confusion: bidirectional relationships.