
Welcome to the third instalment in this series, which tracks the journey to revolutionise law enforcement through advanced data analysis. In this series, expect to uncover a wealth of knowledge that underpins the enhancement of policing methods using graph analytics. Join us at the vanguard of policing technology as we delve into the transformative power of Knowledge Graphs.
This article will cover the practical and beneficial nature of using knowledge graphs to analyse crimes. To start, criminal network analysis is not just about gathering covert and overt data. To become criminal intelligence, information must be analysed and assessed in context with any other sources of information that are known about the subject of inquiry. This, however, is not a simple task. In contrast, consider the following ordinary task we’ve all experienced:
You want to find a restaurant for dinner this evening. A question you might ask is: “What’s an affordable Indian restaurant with outdoor seating near me?”
Most likely, you’ll go on Google Maps, search for something in your area of interest, apply some filters and make your reservation.
In this scenario, you have a good understanding of what you would like, and you have ‘hooks’ that can help to find what you’re looking for: location, type of food, availability of outdoor seating, etc. In this case, a simple search with filters works perfectly. You get the list and refine it, maybe with the use of a map view.
Now, imagine that you’re an analyst who has to solve a crime: you have plenty of forensic evidence, from biometric data (fingerprints, DNA, etc.) to digital data (cell phone data, CCTV, traffic camera, etc.). The type of questions you have to answer is:
“Using cellular data, what are the people close to the victim during the time of the crime?”
“Using traffic data, what are the cars belonging to the suspects, or the victim, or any of their relatives that have been seen around the murder area?”
“Using calling data, who were the last people called by the person and where were they during the call and the murder?”
How would you answer those questions with a search query? You don’t know who the people connected in various ways to the victim are upfront, nor can you pass the list (if you get it) to a search engine. How can you combine the results of multiple searches in a comprehensive view?
Graph analytics – adding a semantic layer to data
Analysts don’t have an objective truth; they start their work with a set of clues and indications. From there, they must discover the truth supported by solid evidence. They do this by navigating a jungle of data coming from various sources until they find what happened with clear and supportive evidence. Searching through each data source is time-consuming and, due to human limitations when analysing results, error-prone. Imagine yourself searching for plates in car registries, for all the cars belonging to the suspects and their relatives. Imagine searching for suspects’ car plates in an Excel file containing all the cars recognised by traffic cameras in a portion of the city during a specific time frame. Imagine doing this again and again because new evidence just came in, which extended the set of suspects or their connection with other people. The above is just an example of what analysts do every day to solve cases and ensure that offenders are identified and brought to justice. Considering the amount of data on a single device (phone, tablet, pc, etc.), and, in general, the amount of data accessible for each investigation (traffic videos and images, cellular towers, digital reports, etc.), it isn’t realistic to expect officers or police staff to always do it manually.
“As long as the police persist in using 20th century methods to try to cope with 21st century technology and ways of life, we will continue to fall further and further behind.” (State of Policing – The Annual Assessment of Policing in England and Wales 2021)
Clearly, it is necessary that law enforcement organisations change their perspective on how they organise the data and how we access it. With the pains of the analysts in mind, let us show you how this would work concretely if the data is organised in a knowledge graph using exploration instead of search.
Data exploration using knowledge graphs for criminal intelligence
Suppose that we have data from multiple sources converged in a single knowledge graph with the following schema:
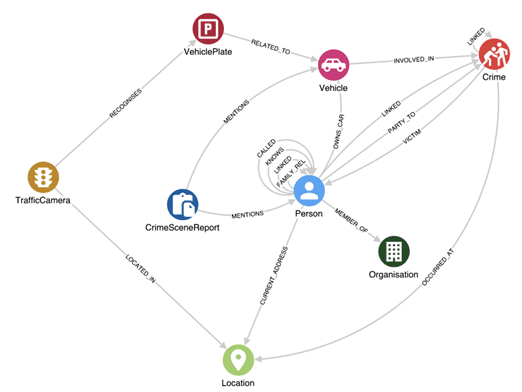
Knowledge graphs not only provide the semantic layer, but they also provide contextual information for each relevant data point. They provide relationships, and, by this, analysts can easily explore data far from each other.
Starting from the schema above, the analyst can easily prepare a knowledge graph query to answer a complex question like: “return all the cars belonging to a victim’s relatives or connections whose plate has been shot by a traffic camera in an area of 10 Km around the murder in the timeframe between X and Y.” It will look like the following:
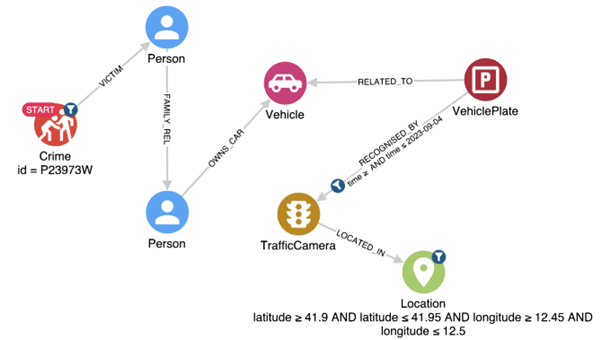
The query will return exactly what you are looking for in the form of real entities, not raw data that you have to further interpret. How would you do it via a simple search? Suppose you have a list of the victim’s relatives, you could query the car registry for each person and get the list of plates. Then, you’d have to search through traffic camera-captured plates, filter by date and search for each plate. Some of these tasks will likely be done manually.
Getting results quicker is not the only advantage. With the knowledge graph, you can literally explore the portion of the graph you need to get your first answer, and then you can further extend it by navigating through the relationships and the nodes. This is what is meant by “exploration”, because the analyst literally follows the thoughts coming from a deeper and deeper understanding of the case, knowing and seeing the path that brought them to that conclusion.
After a first iteration with a subset of the data, generally the first two steps are repeated multiple times, and the knowledge stored in the graph not only grows in terms of “quantity”, by including more data sources, but also in “quality” due to the work of the analysts constantly validating it, improving the schema and enriching it. Hume customers reported how the knowledge graphs now represent a new asset, one of the main ones. It contains the best of the knowledge on different criminal activities and represents the key single source of intelligence for criminal investigations.
