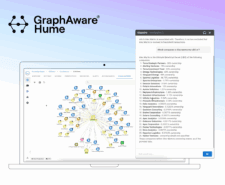
GraphAware & Senzing Partner to Help Analysts and Data Engineers Find Truth in Data Faster with Entity-Resolved Knowledge Graphs.
We had an illuminating time at the ISS Europe conference in Prague 2024. We connected with numerous new prospects from various countries, all recognising the necessity of graph-based criminal analysis. The feedback was clear: while this approach was a novelty two years ago, it has now become a hot topic, with GraphAware Hume leading the charge thanks to our established references in law enforcement and intelligence.
Welcome back to our blog series on unlocking the complex world of ultimate beneficial ownership (UBO) investigations using the power of graph technology. We’ll delve into the various types of investigations that can be conducted with the aid of graph analysis, showcasing the agility, speed, and capability facilitated by tools like GraphAware Hume, our graph analytics platform.
“When a child goes missing, every minute counts. With Hume, we don’t have to start from scratch every time an event like this is reported. Our data is available and ready to be analysed. We can act fast and save lives.Data Science Lead - Government agency”
In today’s intricate financial landscape, uncovering Ultimate Beneficial Ownership (UBO) is more crucial than ever. UBO analysis involves diving into the intricate web of ownership structures, often extending through multiple levels and involving numerous entities. Picture a scenario where a person owns a company, which in turn owns two other companies, and each of those owns two more. Add to this mix various trusts and assets linked to the beneficial ownership, and you have a complex ownership chain or tree. The ultimate goal of UBO analysis is to pinpoint who truly owns these assets and businesses hidden within these labyrinthine...
Step into the forefront of intelligence analytics with GraphAware’s exclusive Bridge Meetup series. Designed to foster a vibrant community of intelligence professionals, we invite you to join us on a journey of discovery.
“In this dynamic landscape, the transition from tactical to strategic intelligence represents a profound paradigm shift—one that promises not just to react to unfolding events but to anticipate and even mould the future.”
Automated tests have become crucial in the field of software engineering in the last few years, even more than in the past. In fact, automated testing is now part of the Continuous Integration / Continuous Delivery (CI/CD) process, so tests may run in different shapes and environments throughout the development of software artefacts.While Unit Tests can be executed by taking apart a core component or class, by mocking every external dependency (DB included), Integration Tests and End-to-End tests require at least one real external component, in order to be as realistic as possible.
Welcome to the third instalment in this series, which tracks the journey to revolutionise law enforcement through advanced data analysis. In this series, expect to uncover a wealth of knowledge that underpins the enhancement of policing methods using graph analytics. Join us at the vanguard of policing technology as we delve into the transformative power of Knowledge Graphs.
Welcome to the second instalment in this series, which tracks the journey to revolutionise law enforcement through advanced data analysis. In this series, expect to uncover a wealth of knowledge that underpins the enhancement of policing methods using graph analysis. Join us at the vanguard of policing technology as we delve into the transformative power of Knowledge Graphs. In the previous chapter, we illustrated the process of transitioning from isolated data silos to a holistic intelligence data system, resulting in a single source of truth.
Welcome to our LLMs and Knowledge Graphs Series. In this collection of blogs, we embark on a journey at the intersection of cutting-edge large language models and graph-based intelligence. Whether you’re a seasoned data scientist, a curious developer, or a business leader seeking actionable insights, this series promises to demystify the synergy between LLMs and knowledge graphs.
“Without being able to analyse data comprehensively and systematically, policing won’t be as efficient as it can be. [State of Policing - The Annual Assessment of Policing in England and Wales 2019]”
Welcome to our LLMs and Knowledge Graphs Series. In this collection of blogs, we embark on a journey at the intersection of cutting-edge large language models and graph-based intelligence. Whether you’re a seasoned data scientist, a curious developer, or a business leader seeking actionable insights, this series promises to demystify the synergy between LLMs and knowledge graphs.
Tax fraud poses a significant challenge for governments and organisations worldwide, resulting in revenue loss, economic instability, and erosion of public trust. Traditional methods of combating tax fraud often fall short due to fraudulent schemes’ complex and constantly evolving nature. These schemes often involve complex networks of entities, transactions, and false documentation, which Relational databases struggle to handle.
As the Chief Scientist at GraphAware, I have the privilege of working at the forefront of two exciting and rapidly evolving fields: graph technology and machine learning. These technologies have seen remarkable progress in recent years, and I am excited to share with you some of the latest developments and breakthroughs that are transforming the way we think about data and its potential.
Maritime piracy is one of the most serious threats to international trade and security. To combat piracy and ensure the safety of vessels, analysts and operators must have a thorough understanding of the real-time situation. Situational awareness (SA) is an important concept for those tasked with combating maritime piracy. It refers to the ability to understand the environment around a vessel and its crew, as well as the ability to recognize and respond to potential threats. This is an especially important skill for analysts looking to identify pirate activity and take action against it.
In the previous blog post, ”The challenges of intelligence analysis and how graphs solve them”, we saw how graphs truly streamline and enhance the workflow for intelligence teams. The next step in the process is setting up your graph.
Ranging across all the varied fields of intelligence, there is an ever-advancing process to enhance and optimise data analysis. For such mission-critical events, graph technology has emerged as an exceptional solution for all stages of the intelligence lifecycle, ensuring the absolute fastest and best results.A graph analytics solution like Hume provides a simple-to-use interface that allows intelligence analysts to search, visualise and analyse intelligence graphs. The most common intelligence analysis questions are graph-based. For instance, “How are person X and person Y connected?” or “Who are the most influential individuals within a criminal organisation?”.
The modernisation of data platforms and the ever-growing availability of data mean that analysts need tools that highlight the information they need to know and when they need to know it. Alerting has become a core feature in many case management and intelligence applications, helping intelligence analysts and investigators keep on top of the changing information landscape for their entities of interest.
In this 3-part series “Know what you know: Competing on Analytics with Knowledge Graphs” Dr. Alessandro Negro, Chief Scientist at GraphAware, walks you through analytics, knowledge graphs and its “competition”. In the first part we discussed the recipe for a successful analytics competition and shared some success stories. In the second part we saw the 4 first stages of the analytics revolution.
In this 3-part series “Know what you know: Competing on Analytics with Knowledge Graphs” Dr. Alessandro Negro, Chief Scientist at GraphAware, walks you through analytics, knowledge graphs and its “competition”. In the first part, we discussed the recipe for a successful analytics competition and shared some success stories.
In this 3-part series “Know what you know: Competing on Analytics with Knowledge Graphs” Dr. Alessandro Negro, Chief Scientist at GraphAware, walks you through analytics, knowledge graphs and its “competition”.
In the series Graphs in Law Enforcement, we discussed data sources and modelling, data quality and credibility with source ratings, and we spoke about fusing entities.
In the first part of the series Graphs in Law Enforcement, Data sources and modelling, we discussed graphs in law enforcement investigations, their data sources, data provenance, INTs and how to model sources in graphs. In part 2, Data quality and credibility, we covered source ratings (source reliability & information credibility) and their importance in investigation graphs for law enforcement.
In this 4-part blog series “Graphs in Law Enforcement”, we will examine Data Sources in Law Enforcement Graphs, a talk by Luanne Misquitta, our VP of Engineering, at GraphConnect 2022.
Criminal investigations are driven by finding the connections and hidden links between wide-ranging sources of data to ultimately disrupt criminal activity. Graph solutions are a powerful tool for law enforcement to optimise their interaction with data from these varied sources.
Knowledge Graphs (KGs) have become the backbone of multiple applications, including search engines, chatbots, and question and answering tools, where interactivity plays a crucial role.
Graph visualisation is just what it sounds like - a visual representation of your data as a graph. A graph is a structure of objects that are connected. Thus graph visualisation is the visualisation of entities (nodes), and relationships among them.
It is always a valuable opportunity to understand our product better and recognize user needs. At GraphAware, building Hume, a graph-powered insight engine, we are proud of making an impact on our customers’ success. However, we use Hume also to support our processes and help our own needs. In the case of the event that took place throughout December, we were also able to have great fun and integrate the team.
Graphs are a natural fit for investigative use cases. Whenever you want to analyse a situation containing people, objects, locations, and events (POLE), graphs emphasising relationships between objects are your natural companion.
Welcome to the first blog in the business series of GraphAware blog! This series is designed for us non-techies out there. Personally, I was shocked when I found out how big and common knowledge graphs are and how often graph databases are used in today's world - and I had first heard of them just a couple of months ago. So, for people like me, for marketers and non-tech people in business, I'll try to open the door to the world of graphs, and their potential and take you through it step-by-step. It seems only appropriate that we start with...
This blog post is the first part in a series on Effective Graph Visualisations, showcasing features emerging from years of experience in the field.
Knowledge Graphs (KGs) have become one of the most powerful tools for modeling the relations between entities in various fields, from biotech to e-commerce, from intelligence and law enforcement to fintech. Starting from the first version proposed by Google in 2012, the capabilities of modern KGs have been employed across diverse applications, including search engines, chatbots, and recommendation systems.
In our last Metropolitan Art Collections post we ingested and processed part of a dataset containing more than 470,000 artworks from The Metropolitan Museum of Art and created a knowledge graph using Hume, GraphAware’s insights engine.
The Metropolitan Museum of Art recently published a dataset of more than 470,000 works of art under the CC-zero License. Representing such a collection as a knowledge graph allows us to explore it in a unique way - seeing the artworks, their authors, donors, mediums, tags, or art movements deeply connected, being able to traverse the links between them and discover unexpected relations.
If you have read our post Hume in Space: Monitoring Satellite Technology Markets with a ML-powered Knowledge Graph, you surely wonder: is there a way to extract relations among named entities without heavy investment? Investment in terms of time to label training dataset and to develop, train and deploy a machine learning model?
Everyone has a passion for something. Be it music, politics, sports, coffee or … pancakes. Such passion makes you strive for new information, for understanding of the current trends. Take pancakes: you might watch for new recipes on your favourite website, you might look at cooking shows or youtube videos to get more inspiration about how to serve them … but overall, you can probably handle this pretty well. It’s not like there is much room for revolutionising the pancake recipe.
“Lateral thinking” was a big topic back in 2004 when I was in the Network Operations Center (NOC) business; one definition is:
Do you think there is no space for a graph database in your company? Or it would be a huge effort to integrate a graph database into your product? I have to tell you: You can use a graph database like Neo4j without touching your product, and you can use it for managing your company’s knowledge as well as to improve your software development process. So, even if your business problem is not inherently graphy, there are a few reasons why you should think about your environment as a graph.
Data is everywhere. News, blog posts, emails, videos and chats are just a few examples of the multiple streams of data we encounter on a daily basis. The majority of these streams contain textual data – written language – containing countless facts, observations, perspectives and insights that could make or break your business.
It is often useful to relate a piece of text with the sentiment expressed in it. Extracting and processing sentiments from text provides not only a new emotional access pattern to your corpus but also new knowledge which can reveal new insights. Suppose you want to build a recommendation engine which leverages reviews to spot detailed strengths and weaknesses of different hotels, such as good location but bad staff. Or, it certainly makes a difference whether an article talks about your organization in a positive or negative manner.
One of the key components of Information Extraction (IE) and Knowledge Discovery (KD) is Named Entity Recognition, which is a machine learning technique that provides us with generalization capabilities based on lexical and contextual information. Named Entities are specific language elements that belong to certain predefined categories, such as persons names, locations, organizations, chemical elements or names of space missions. They are not easy to find and subsequently classify (for example, organizations and space missions share similar formatting and sometimes even context), but having them is of significant help for various tasks: improving search capabilities relating documents among themselves or...
Representation is one of the most complex and compelling tasks in machine learning. The way in which we represent facts, events, objects, labels, etc. affects how an autonomous learning agent can analyze them and extract insights, make predictions and deliver knowledge.
“Relevance is the practice of improving search results for users by satisfying their information needs in the context of a particular user experience, while balancing how ranking impacts business’s needs.” [1]
In the Bersin Predictions for 2016 report, Josh Bersin states that “it feels as though everything in the world of talent is changing – from the way we recruit and attract people, as well as how we reward them, to the way we learn, and how we curate and manage our entire work-life experience”[1].