
What is a knowledge graph?
A knowledge graph is a way of connecting and organising information so that people, organisations, locations, events, and other entities can be understood in context.
Unlike traditional databases that store information in rows and tables, knowledge graphs focus on relationships. They show how entities are connected, making it easier to explore data, uncover hidden patterns, and answer complex questions.
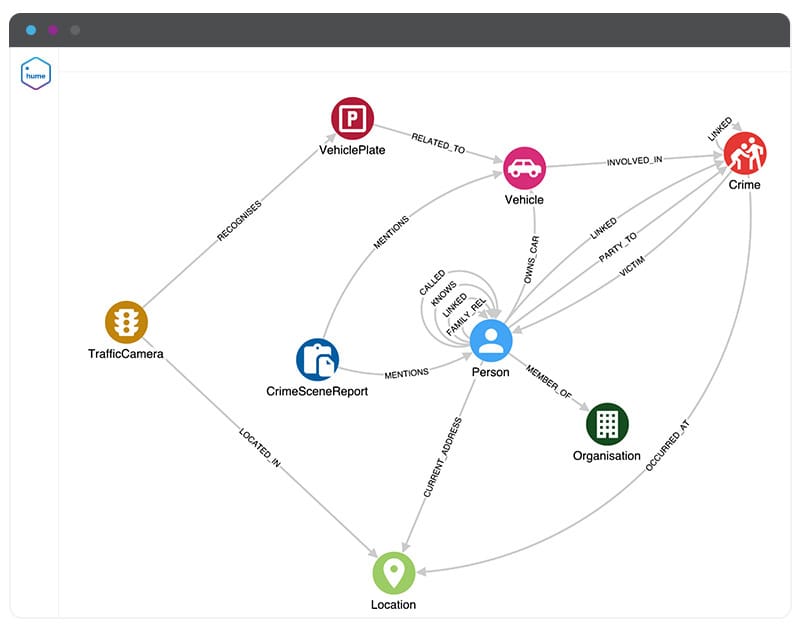
A knowledge graph consists of:
- Entities (nodes) such as people, organisations, locations, devices, or events
- Relationships (edges) that describe how those entities are connected
- Properties that provide additional information about entities and relationships
For example, a knowledge graph might connect a suspect to a phone number, a vehicle, a location, and a series of events. Rather than viewing those records separately, analysts can understand how they relate to one another within a connected intelligence picture.
Knowledge graphs are widely used in intelligence analysis, fraud detection, cybersecurity, financial services, and search technologies because they help organisations understand not only what exists in their data, but how everything is connected.
How does a knowledge graph work?
Knowledge graphs bring together information from multiple sources and organise it around entities and relationships.
The process typically involves:
Data integration
Data is collected from multiple sources, including databases, documents, open-source intelligence, transaction records, communication data, and operational systems.
Entity extraction and enrichment
Relevant entities such as people, organisations, locations, accounts, devices, or events are identified and enriched with additional information.
Relationship creation
Connections between entities are established, allowing analysts to understand how different pieces of information relate to one another.
Analysis and exploration
Once data is connected, analysts can search, visualise, query, and analyse the graph to identify patterns, relationships, anomalies, and investigative leads.
As new information becomes available, the knowledge graph can be updated continuously, creating a living representation of the data landscape.
Why are knowledge graphs important?
Many organisations struggle with fragmented information spread across multiple systems.
Critical information often exists, but relationships between datasets remain hidden. This makes investigations slower, increases analytical effort, and can cause important connections to be missed.
Knowledge graphs help overcome these challenges by:
- Connecting data from multiple sources
- Breaking down information silos
- Providing context around entities and events
- Supporting explainable analysis
- Revealing hidden relationships
- Enabling faster decision-making
By placing relationships at the centre of analysis, knowledge graphs help organisations move from disconnected data to connected intelligence.
Common knowledge graph use cases
Intelligence analysis
Knowledge graphs help intelligence teams understand how people, organisations, locations, events, and assets are connected.
Analysts can use knowledge graphs to:
- Investigate criminal networks
- Analyse POLE data
- Identify hidden relationships
- Discover investigative leads
- Support evidence-based decision-making
By connecting information from multiple sources, analysts can build a more complete operational picture and uncover patterns that may otherwise remain hidden.
Fraud detection
Fraud often involves networks of connected entities rather than isolated transactions.
Knowledge graphs help investigators identify suspicious relationships between accounts, individuals, businesses, devices, addresses, and transactions.
This enables organisations to:
- Detect organised fraud rings
- Identify hidden connections
- Reduce false positives
- Accelerate investigations
- Improve risk assessment
Cybersecurity
Modern cyber threats generate large volumes of interconnected data across users, devices, systems, alerts, and events.
Knowledge graphs help security teams understand how incidents unfold, identify attack paths, and uncover relationships between seemingly unrelated events.
Common applications include:
- Threat investigation
- Attack-path analysis
- Identity and access monitoring
- Security operations
- Threat intelligence
Financial services
Financial institutions use knowledge graphs to understand customer relationships, improve compliance processes, and manage risk.
Applications include:
- Anti-money laundering (AML)
- Know Your Customer (KYC)
- Risk management
- Customer intelligence
- Regulatory compliance
How GraphAware Hume uses knowledge graphs
GraphAware Hume uses knowledge graphs to connect people, organisations, locations, events, documents, and other entities into a single operational picture.
By combining graph technology, graph-powered intelligence analysis, and AI-assisted workflows, GraphAware Hume helps analysts uncover relationships, identify patterns, and accelerate investigations.
Using GraphAware Hume, analysts can:
- Explore connected data visually
- Perform link analysis
- Investigate entities and relationships
- Analyse temporal and geospatial information
- Combine structured and unstructured data
- Generate explainable insights from connected information
This helps organisations move from fragmented information to connected intelligence that supports operational decision-making.
See knowledge graphs in action
Knowledge graphs become most valuable when analysts can explore connected data, investigate relationships, and generate insights within a single environment.
Watch the demonstration below to see how GraphAware Hume helps analysts use knowledge graphs to uncover hidden connections and accelerate investigations.
FAQs
What is a knowledge graph in simple terms?
A knowledge graph is a connected representation of information that shows how people, organisations, locations, events, and other entities relate to one another.
What are knowledge graphs used for?
Knowledge graphs are used in intelligence analysis, fraud detection, cybersecurity, financial services, search engines, recommendation systems, and many other domains where understanding relationships between data is important.
Why are knowledge graphs important?
Knowledge graphs help organisations connect fragmented information, provide context, reveal hidden relationships, and support more informed decision-making.
What is the difference between a graph database and a knowledge graph?
A graph database is a technology used to store and query connected data. A knowledge graph is a connected representation of information that combines data, relationships, meaning, and context.
Think of a graph database as the platform that stores connected data, while the knowledge graph is the model that helps people and systems understand that data.
What is the difference between knowledge graphs and link analysis?
Knowledge graphs and link analysis are closely related, but they are not the same thing.
A knowledge graph provides the connected data foundation by modelling entities and relationships across multiple sources. Link analysis is an analytical technique used to explore and understand those relationships.
In practice, analysts often use link analysis on top of a knowledge graph to:
- Investigate networks
- Identify influential entities
- Discover hidden relationships
- Explore connections between people, organisations, and events
Rather than competing approaches, knowledge graphs and link analysis complement one another.
How do knowledge graphs support intelligence analysis?
Knowledge graphs help analysts combine information from multiple sources, investigate networks, uncover hidden relationships, and build a more complete understanding of complex situations.
How do knowledge graphs help detect fraud?
Knowledge graphs reveal connections between accounts, individuals, businesses, devices, and transactions, helping investigators identify suspicious patterns and organised fraud networks.
Does GraphAware Hume use a knowledge graph?
Yes. GraphAware Hume uses knowledge graphs to connect information from multiple sources and support graph-powered intelligence analysis.