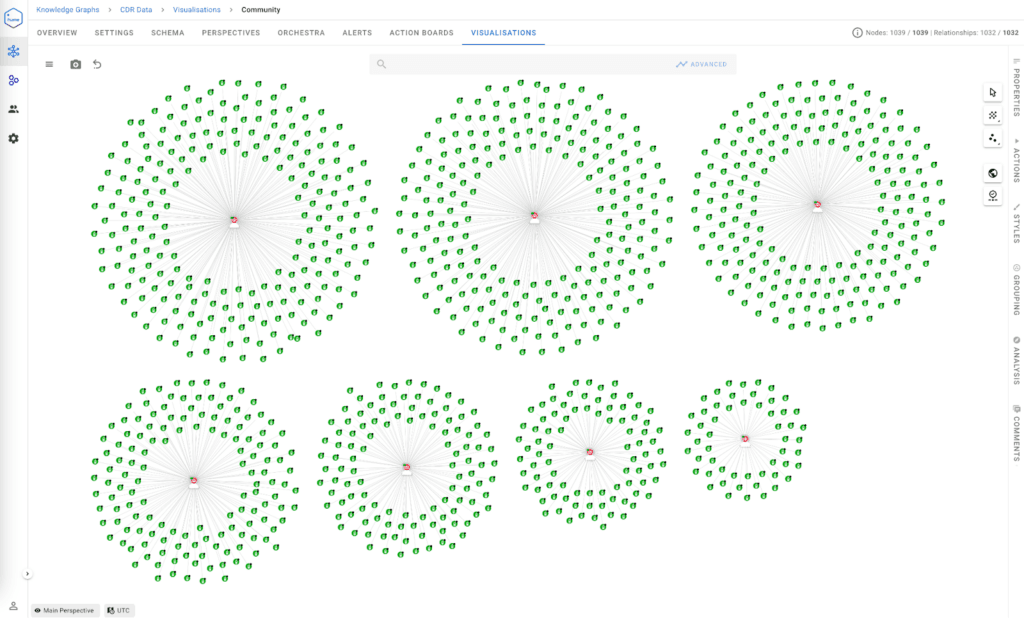
Data visualisation, in essence, is the act of turning a messy pile of data into a beautiful, organised visualisation. It’s the art of making complex data sets understandable and engaging through visual elements like knowledge graphs, nodes and maps. This article will dive into the world of data visualisation, exploring its definition, principles, advantages, and its importance in various fields.
What is Data Visualisation?
Imagine trying to understand a massive spreadsheet filled with numbers. Now, picture that same data transformed into a colourful, easy-to-read graph. That’s data visualisation. It’s about using visual elements to present information and data in a way that’s easy to understand. It’s a crucial part of data analysis, helping us see trends, outliers, and patterns that might be hidden in raw data.

The Main Purpose and Importance of Data Visualisation
The main goal of data visualisation is to simplify complex data sets and make them more accessible. Visual representations help us quickly grasp patterns and insights that might be missed in raw data. Data visualisation is important because it enhances our understanding of data, speeds up decision-making, and improves communication.
Principles of Data Visualisation
To create effective data visualisations, we need to follow some key principles:
- Clarity: The visualisation should clearly convey the intended message without unnecessary complexity. Simple and straightforward visuals ensure the information is easily understood.
- Simplicity: Avoid overcrowding the visualisation with too much information. Focus on the most critical data points to keep the visual concise.
- Accuracy: Ensure the data represented is accurate and free from distortion. Misleading visuals can lead to incorrect conclusions.
- Consistency: Use consistent visual elements, such as colours and fonts, to maintain coherence throughout the visualisation.
- Relevance: Highlight the most relevant data that supports the main message. Irrelevant information can distract from the key points.
- Engagement: Create visuals that are not only informative but also engaging. Captivating visuals can help retain the audience’s attention.
Advantages of Data Visualisation
Data visualisation offers numerous benefits:
- Enhanced data comprehension: Visualising data makes it easier to understand complex information and derive meaningful insights.
- Faster decision-making: Visual data representation enables quicker analysis and informed decision-making.
- Improved communication: Data visualisations facilitate better communication by presenting data in a clear and engaging format.
Difference Between Data Visualisation and Traditional Reporting
Traditional reporting often involves presenting data in tabular or textual formats, which can be time-consuming to interpret. Data visualisation, on the other hand, uses graphical representations to present information, making it quicker and easier to understand trends and patterns.
Data Visualisation in Big Data
In the context of Big Data, data visualisation is crucial for making sense of large and complex data sets. It helps organisations, including criminal agencies and businesses, analyse trends, patterns, and outliers, enabling them to derive actionable insights.
Importance in Business Analytics
Data visualisation plays a pivotal role in business analytics by transforming raw data into visual insights that drive strategic decision-making. It helps businesses track performance metrics, analyse market trends, and optimise strategies.
Importance in Law Enforcement
In law enforcement, data visualisation is essential for analysing crime data, identifying patterns, and making data-driven decisions. It aids in mapping out crime networks, tracking illicit activities, and enhancing overall efficiency in solving cases.
Data Visualisation in AML
In Anti-Money Laundering (AML), it helps detect suspicious patterns and transactions. Visualising transaction data and network connections can reveal anomalies, enabling organisations to identify and prevent fraudulent activities.
Data Visualisation Algorithms
A data visualisation algorithm is a set of computational rules used to transform raw data into visual formats. These algorithms help generate charts, graphs, and other visual representations, making it easier to analyse and interpret data.
Data Visualisation Software and Tools
Various tools are available for data visualisation, each catering to different user needs:
- Tableau: A popular tool for creating interactive and shareable dashboards.
- Power BI: Microsoft’s business analytics tool for visualising data and sharing insights.
- D3.js: A JavaScript library for producing dynamic, interactive data visualisations in web browsers.
Graph analytics tools differ from traditional BI tools in that they focus on analysing relationships within data sets, such as social networks or fraud detection. Large-scale tools like Apache Hadoop and Spark handle massive data volumes and complex computations, making them suitable for advanced data analysis tasks.
Data Visualisation for Intelligence Agencies and Police
Data visualisation aids intelligence agencies and police in several ways, such as crime mapping and network analysis. These techniques help identify hotspots, trends, and relationships between suspects or criminal organisations.
Examples of Data Visualisation Use Cases
- Business Analytics: Tracking sales, market trends, and performance metrics.
- Healthcare: Visualising patient data, disease outbreaks, or medical research findings.
- Criminal Investigation: Mapping out crime networks or tracking illicit activities.
Data Visualisation for Fraud Detection
Visualising transaction data and network connections can uncover anomalies or suspicious patterns, helping organisations detect and prevent fraudulent activities. Data visualisation tools highlight irregularities that might go unnoticed in traditional data analysis methods.
Is Data Visualisation Easy?
The ease of data visualisation depends on the complexity of the data and the tools used. While some tools are user-friendly and require minimal technical expertise, others may demand advanced skills to create sophisticated visualisations.
Conclusion
Data visualisation is a powerful tool for transforming complex data sets into actionable insights. By leveraging visual elements like charts, graphs, and maps, it enhances data comprehension, speeds up decision-making, and improves communication. Whether in business analytics, law enforcement, or healthcare, data visualisation is indispensable for making sense of data and driving informed decisions.
