Intelligence-led policing uses data and analytical techniques to help analysts uncover patterns, prioritize investigative leads, and make better-informed decisions. Human judgement remains at the center of every investigation.
In practice, that looks like:
- Discovering hidden relationships in data that already exists
- Prioritizing which leads are worth investigating first
- Helping analysts understand complex criminal networks
- Making intelligence outputs more evidence-based, not less
Most agencies already hold the data they need for intelligence-led policing, just spread across systems that don’t talk to each other: case files, reports, databases, and records from different teams. A knowledge graph connects it.
Rather than storing each piece separately, it links people, places, events, and objects together as an evolving network, so the relationships between them become visible, not just the individual records themselves.
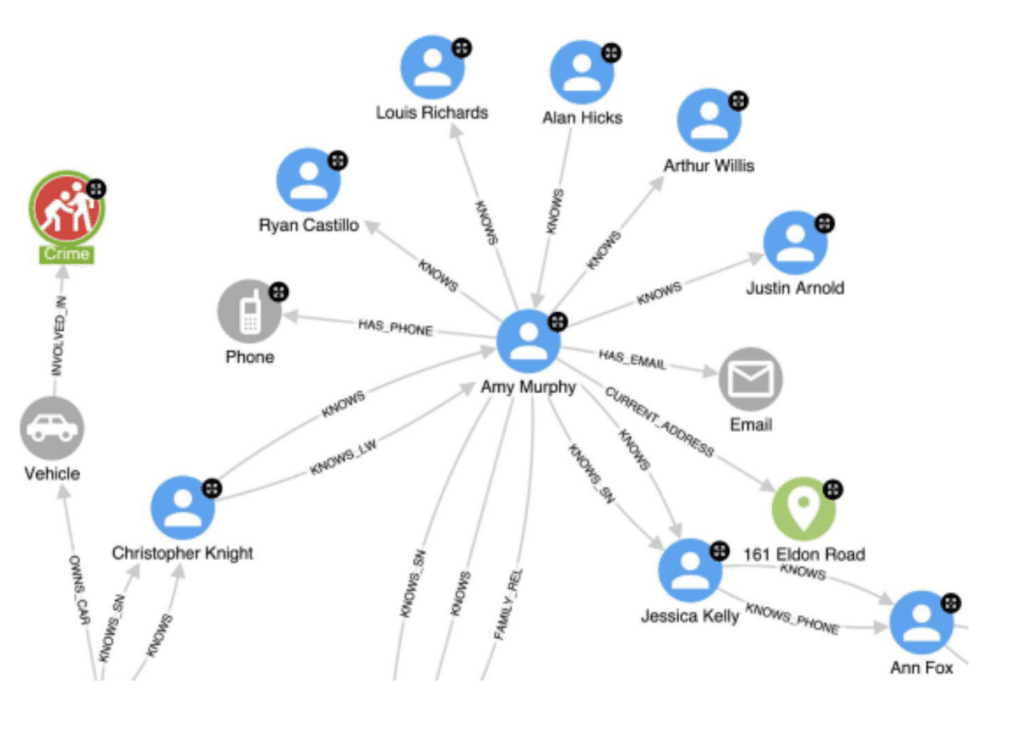
Once that connected picture exists, and it’s been validated and built into daily analytical work, this kind of intelligence-led policing becomes practical.
What we build is grounded in science and well-established theory, and it prioritizes transparency, so an analyst can build real trust in the outputs they’re working from.
Co-offending network analysis
A co-offending network links individuals who have committed crimes together, shifting the analysis from individual suspects to group behavior. That matters most for organized crime, trafficking, and terrorism, where the concealed structure of a group tells investigators more than any single actor could.
Because a knowledge graph already holds the relationships among people, events, locations, and incidents, analysts can derive this network directly from it, and where the data includes a temporal dimension, they can track how a group behaves over time rather than as a single, frozen picture.
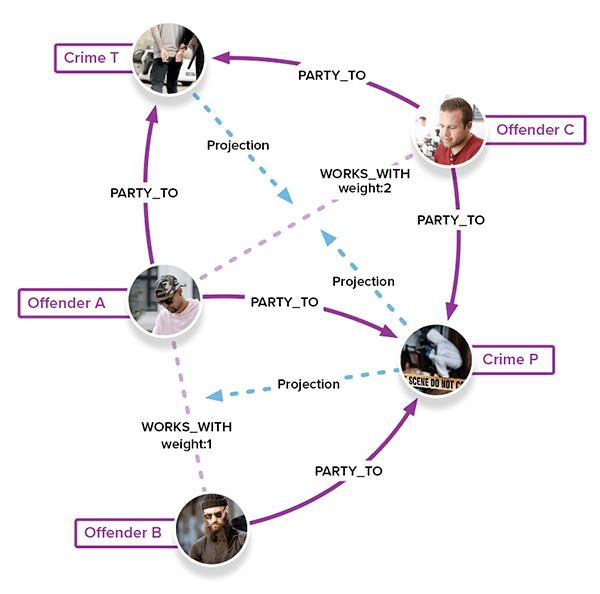
From there, the analysis extends in a few directions:
- Whole-network analysis to gauge how large, dense, and tightly connected an offending network is
- Subgraph discovery to identify distinct organized groups and how they interact
- Node analysis to find the individuals whose position makes them influential or operationally important
- Network evolution to track new entrants, shifting influence, or a group splintering over time
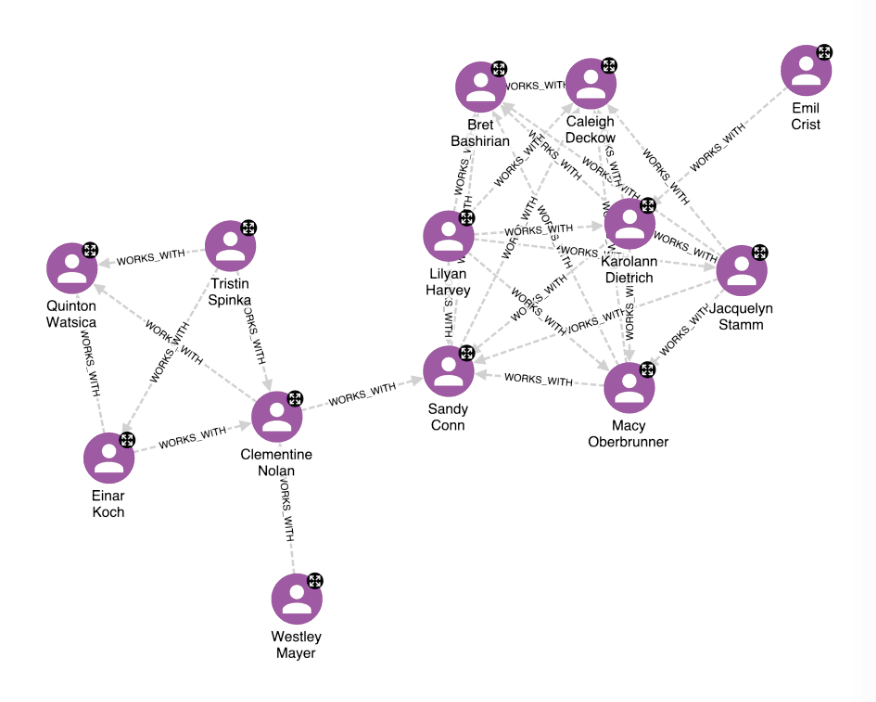
That gives analysts a clearer picture of where a group’s structure is vulnerable, and investigators a clearer set of individuals who warrant closer attention.
Transparency builds trust
An analyst can’t act on a result they can’t explain and trace back to its source.
If an algorithm highlights a likely connection or flags someone as central to a network, an analyst needs to see the reasoning behind it, such as which data supported it, how confident the result is, and where it might be wrong.
Keeping that reasoning attached to the result, rather than hiding it behind a black box, is what turns an output into something an analyst can actually defend, rather than a verdict they cannot explain.
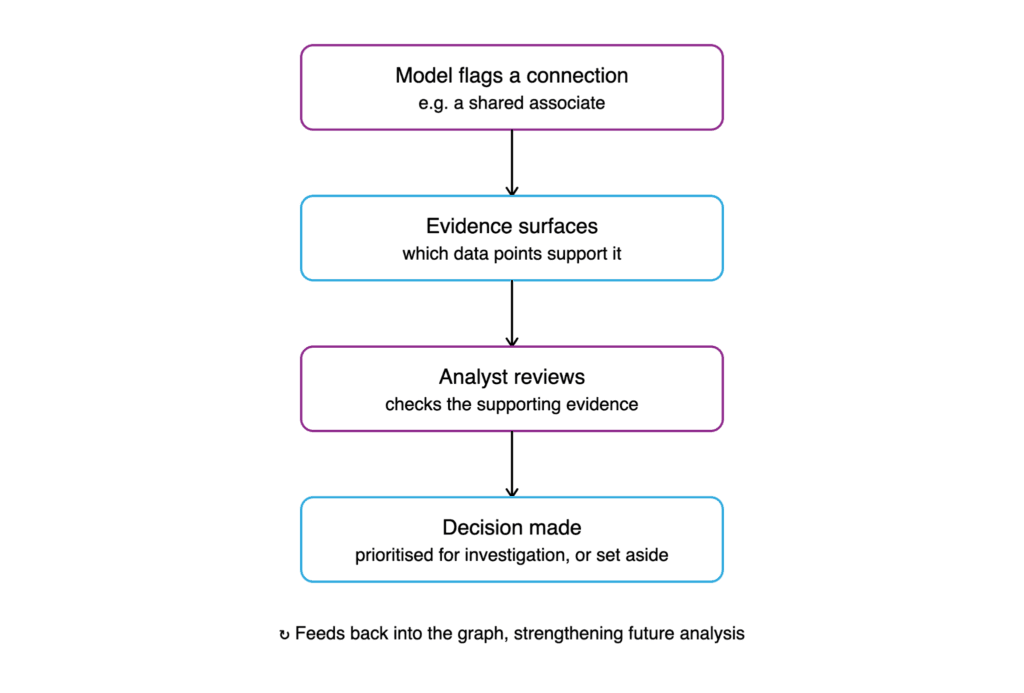
That’s the difference this whole approach depends on. A predicted or inferred connection is not a fact. It’s a lead, and it stays a lead until an analyst has checked it against the wider picture and decided it’s worth acting on. The analyst does that work, not the algorithm, which is really the whole point.
Revealing hidden relationships with link prediction
A network built from known data only ever shows what’s already been recorded. Link prediction estimates what hasn’t, surfacing pairs of individuals who are statistically likely to be connected even though nothing in the data says so directly.
It works by training a model on the existing graph to judge how likely an unrecorded connection is between two entities. Cross a certain threshold, and the link is prioritized for further investigation rather than as an established fact.
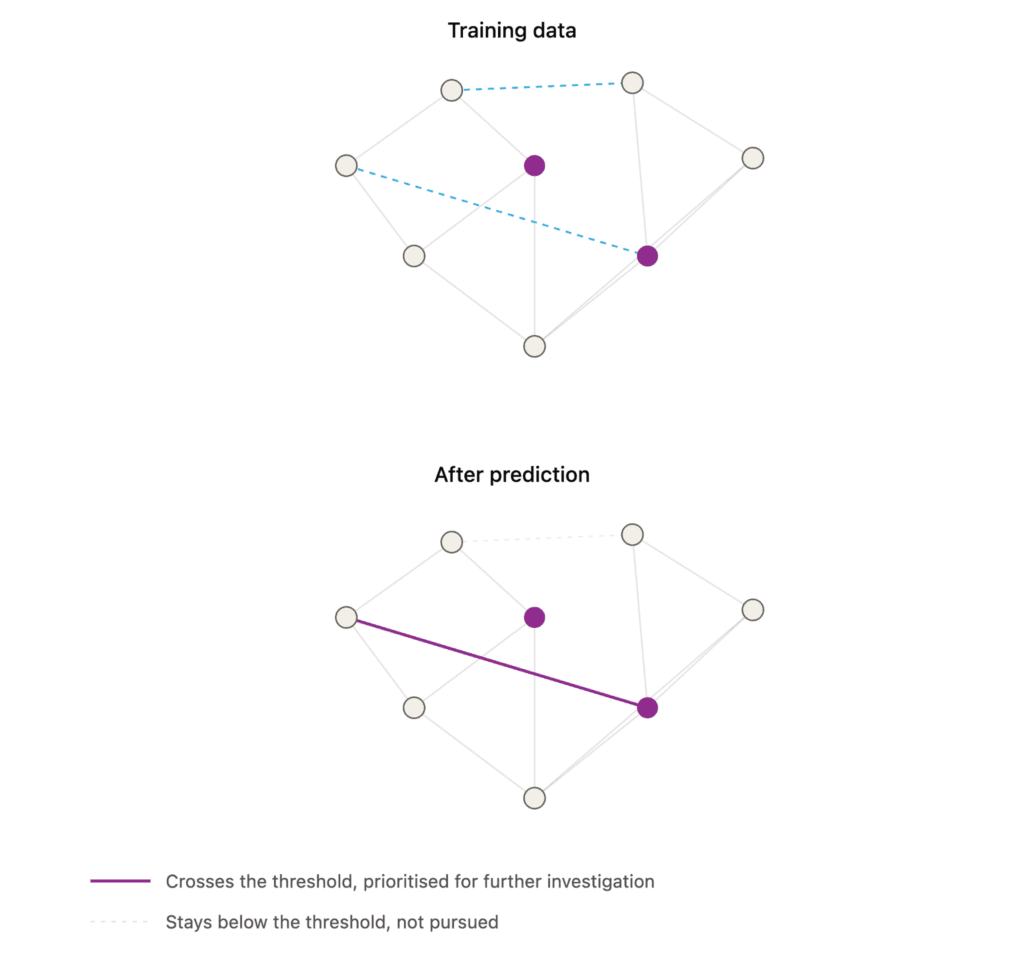
That supports several tasks: strengthening a co-offending network with relationships it’s missing, filling gaps in the knowledge graph, surfacing concealed associations worth a second look, and pointing investigators toward individuals connected to people or events already under scrutiny.
Once a network is more complete, after predicting links, centrality analysis is what turns it into something useful. Centrality measures are a family of graph algorithms that assess how important an individual is to a network, based on their position and role within it, rather than simply on how many connections they have. Betweenness centrality is one example. It highlights the people who bridge otherwise separate groups, the ones who may be coordinating activities, or who allow information, resources, or people to move between clusters that would otherwise stay apart.
The difference is visible in practice. Comparing a co-offending network before and after link prediction, running betweenness across the completed picture, several individuals who looked minor beforehand showed far higher betweenness once their hidden connections surfaced; people who turned out to be bridging two groups that had looked unconnected.
Neo4j GraphAware Intelligence Analysis uses GraphAware Hume to apply graph algorithms like these, helping analysts move from a raw network to a prioritised set of leads. The output is still just that: a set of leads. What an analyst does with them, deciding which are worth investigating further, is where the real intelligence work happens.
Where this is heading
Most law enforcement information still arrives in unstructured form, as reports, statements, and notes. Bringing large language models (LLMs) into this picture, alongside the knowledge graph rather than instead of it, can speed up the process of turning that raw text into structured, connected data. It can also help translate what the graph finds into plain language, so the output reaches whoever needs to act on it, not only the analyst who ran the query.
That widens who can use a connected intelligence picture, from patrol officers through to senior analysts. It doesn’t change what makes any of it trustworthy. An LLM can help structure the data and explain the output. It’s still the analyst who decides what the connections mean, and what happens next.
That’s really the point of all of this: not a machine predicting outcomes, but analysts working from a fuller, more connected picture, and investigators acting with more confidence on the outputs they receive.