
What is graph technology?
Graph technology is a way of storing, connecting, and analysing data based on the relationships between entities.
Relational databases are designed around structured records and tables. They are highly effective for storing and retrieving defined information, but investigations often require analysts to understand the relationships between that information:
- Who is connected to a suspected criminal network?
- Which companies are controlled by the same individuals?
- How do seemingly unrelated events form part of a wider pattern?
- What links exist between people, places, organisations, accounts, and communications?
Graph technology is designed around these questions.
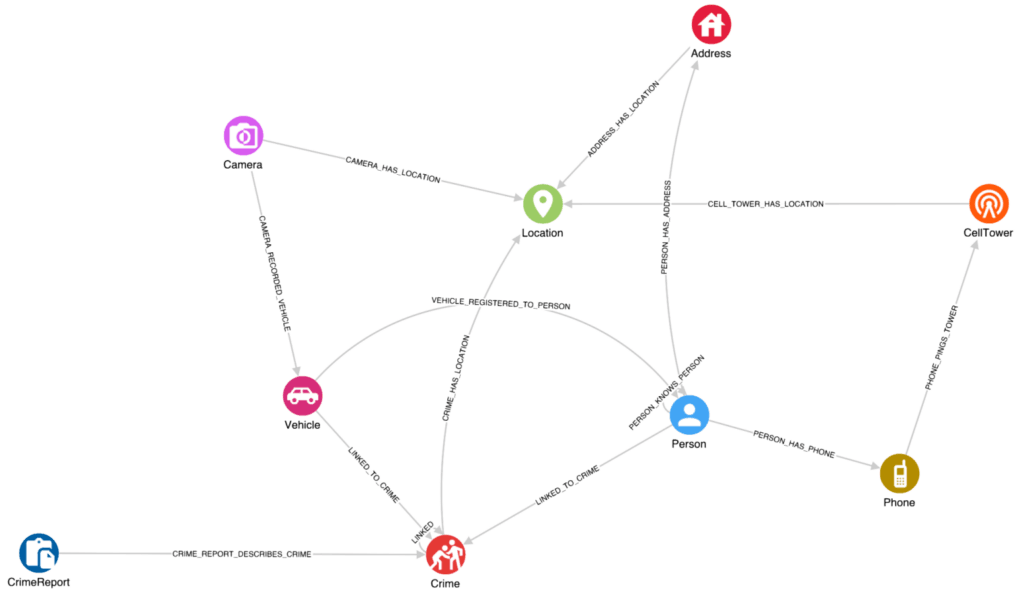
Instead of treating data points as isolated records, graph technology represents information as a network of entities and relationships. Entities become nodes in the graph, while the connections between them become relationships, or edges.
For an intelligence investigation, a graph might represent:
- A person connected to a phone number
- A phone number linked to a device
- A device used near a known location
- A company owned by another company
- A bank account involved in a series of transactions
The value comes from seeing the relationships between these entities, not just the entities themselves.
Why relationships matter in intelligence analysis
Most investigative data contains valuable information about relationships, but traditional data structures often make those relationships difficult to explore.
Consider a financial crime investigation involving a suspected money laundering network.
A traditional database may contain:
- Customer records
- Bank accounts
- Transactions
- Company registrations
- Addresses
Each dataset may be stored separately, requiring analysts to manually join information together.
A graph approach connects these elements:
- Person A owns Company B
- Company B controls Account C
- Account C transfers money to Account D
- Account D is linked to Person E
The investigation becomes a connected picture rather than a collection of disconnected records.
This does not replace analyst judgement. Instead, graph technology helps analysts explore hypotheses faster, identify relevant relationships, and understand how pieces of evidence fit together.
How does graph technology work?
At its core, graph technology consists of three main components:
Entities
Entities represent the things an organisation needs to analyse.
Depending on the investigation, these might include:
- People
- Organisations
- Vehicles
- Locations
- Devices
- Accounts
- Events
- Documents
An entity can have attributes that provide additional context, such as a person’s date of birth, an organisation’s registration details, or a device identifier.
Relationships
Relationships describe how entities are connected.
Examples include:
- Person owns company
- Person communicates with person
- Account transfers money to account
- Device used by person
- Vehicle associated with location
Relationships can also contain information of their own, such as timestamps, confidence levels, or the source of the information.
This is particularly important in intelligence environments, where understanding why a connection exists and how reliable it is matters as much as the connection itself.
Graph models
A graph model defines the types of entities and relationships that can exist.
For example, an organised crime investigation may use a model containing:
- Person
- Organisation
- Location
- Communication event
- Financial transaction
connected by relationships such as:
- MEMBER_OF
- OWNS
- COMMUNICATED_WITH
- TRANSFERRED_FUNDS_TO
When applied consistently, this structure provides a shared framework for analysing information across investigations.
Graph technology and intelligence investigations
Graph technology is particularly valuable in investigations where the objective is to understand networks, behaviours, and hidden relationships.
Mapping criminal networks
Organised crime groups rarely operate as simple hierarchies. They are networks of people, businesses, locations, communication channels, and financial activity.
Graph technology allows investigators to analyse:
- Key individuals within a network
- Links between criminal associates
- Shared assets or infrastructure
- Communication patterns
- Changes in relationships over time
Rather than only identifying known suspects, analysts can explore the wider network and identify previously unknown connections.
Following financial relationships
Money laundering investigations often involve complex chains of transactions designed to obscure ownership and movement of funds.
Graphs help analysts follow:
- Beneficial ownership structures
- Links between companies
- Transaction flows
- Shared addresses
- Intermediaries
This can reveal patterns that may be difficult to identify when analysing individual transactions separately.
Analysing communications
Communications data is inherently relational.
A graph can represent:
- Who communicated with whom
- When communication occurred
- Frequency of contact
- Connections between groups
This supports communication analysis by helping analysts identify important relationships, clusters, and changes in behaviour.
Understanding hostile networks
National security investigations often involve incomplete information collected from multiple sources.
Graph technology helps analysts connect:
- Individuals
- Organisations
- Locations
- Online identities
- Events
- Intelligence reports
By bringing these sources together, analysts can build a more complete understanding of complex networks while maintaining visibility of where information came from.
Graph technology, graph databases, and knowledge graphs
These terms are often used together, but they describe different concepts.
Graph databases
A graph database is a database designed specifically to store and query connected data.
Traditional relational databases store information in tables. Graph databases store information as nodes and relationships, making it efficient to explore connections between data points.
For example, asking:
“Find all people connected to this organisation through ownership, communication, or financial activity within the last five years”
is naturally suited to a graph database.
Graph databases are the underlying storage layer that enables many graph applications.
Knowledge graphs
A knowledge graph represents information about entities and their relationships in a structured way, often adding meaning and context through schemas or ontologies.
Knowledge graphs are commonly used to support applications that require meaning and context, including semantic search, data integration, and some AI-assisted workflows.
In intelligence environments, knowledge graphs can help bring together information from multiple sources while maintaining relationships and meaning.
Graph visualisation
Graph visualisation is the visual representation of connected data.
A graph visualisation may show:
- People connected through communications
- Companies linked through ownership
- Events arranged across a timeline
- Locations connected through movement patterns
Visualisation helps analysts explore information, but the visual interface itself is not the graph technology. The graph model and underlying data structure enable the analysis.
Graph technology and AI
Graph technology and artificial intelligence are increasingly used together, particularly in situations where AI systems need to understand relationships between information.
Large language models (LLMs) are effective at processing and generating language, but they do not inherently understand the specific relationships, provenance, or operational context within an organisation’s data.
Graph technology can help provide this context by representing information as connected entities and relationships. For example, a graph can show that:
- A company is linked to several directors.
- A person appears across multiple intelligence reports.
- A series of transactions forms part of a wider network.
- Several events are connected through a shared location or device.
This connected context can support AI systems by improving retrieval and helping models work with information that is relevant to a specific investigation.
However, graph technology does not remove the need for analyst judgement, and it does not guarantee accurate AI outputs. In intelligence environments, AI systems must still provide transparency around the information used, the reasoning process, and the sources supporting an answer.
Approaches such as GraphRAG explore how graph structures can be combined with retrieval-augmented generation (RAG). However, for high-stakes analysis, the focus is not simply generating a response. It is creating a workflow where analysts can inspect, validate, and trust the information behind that response.
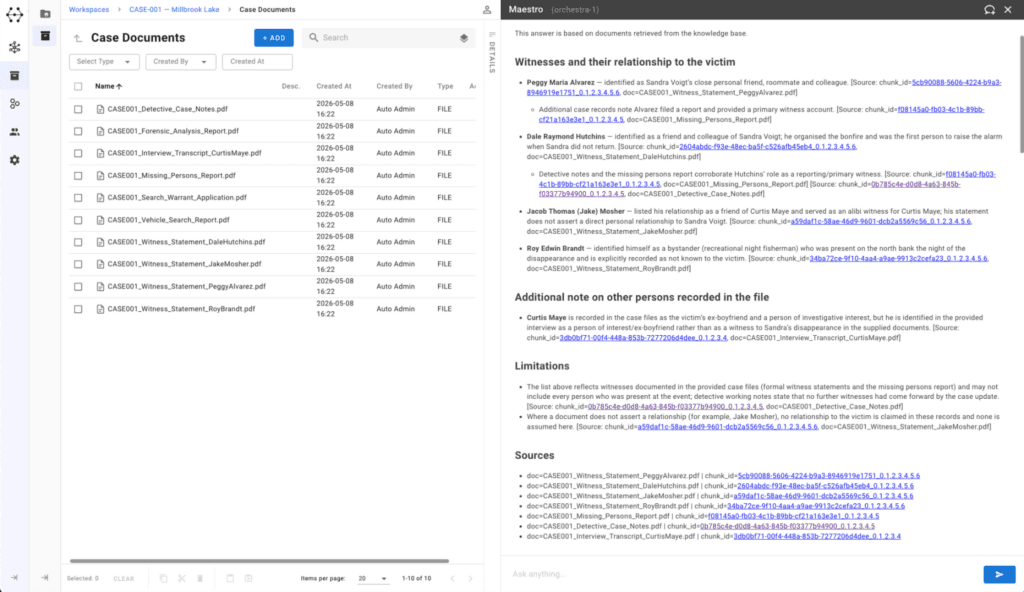
GraphAware Hume’s upcoming Document Intelligence feature follows this principle by using an agentic RAG approach, where retrieval is iterative, sources remain visible, and analysts can trace answers back to the underlying documents.
Benefits of graph technology for intelligence teams
Exploring complex relationships
Graph technology makes it easier to navigate relationships across large and complex datasets.
Instead of manually joining information from multiple sources, analysts can explore connections directly.
Understanding networks and patterns
Graphs reveal structures that may remain hidden in disconnected datasets, helping analysts identify:
- Key individuals
- Influential entities
- Central locations
- Unexpected relationships
Improved data integration
Investigations often rely on information from many sources.
Graph technology provides a way to connect different datasets around shared entities and relationships, creating a more complete investigative picture.
Greater transparency
Relationships can be traced back to their source, helping analysts understand:
- Why two entities are connected
- Where information originated
- How confident they should be in a relationship
This supports explainable and defensible intelligence analysis.
How GraphAware Hume uses graph technology
GraphAware Hume applies graph technology to support intelligence analysis workflows, helping analysts connect information, explore relationships, and investigate complex networks.
Rather than treating data as isolated records, GraphAware Hume provides a connected view of information across sources, allowing analysts to explore:
- Relationships between entities
- Patterns across investigations
- Activity over time
- Geographic connections
- Supporting evidence and provenance
For intelligence teams, this means analysts can investigate relationships directly within their working environment while maintaining visibility of where information originated and how conclusions were reached.
Graph technology provides the foundation. Analyst expertise remains central.
The future of graph technology
Graph technology is likely to become increasingly important as intelligence teams face larger volumes of connected, multi-source information.
Key areas of development include:
Graph technology and generative AI
Graph-based approaches are being explored as a way to provide AI systems with structured context, supporting more grounded retrieval and more transparent analysis workflows.
Real-time intelligence analysis
As investigations evolve, teams need to understand changing relationships and emerging networks. Graph technology supports the continuous analysis of connections between people, events, organisations, and locations.
FAQs
What is graph technology used for?
Graph technology is used to analyse connected data where relationships between entities are important. In intelligence and investigations, this includes activities such as mapping criminal networks, analysing financial relationships, understanding communications patterns, and connecting information from multiple sources.
What is the difference between graph technology and a graph database?
Graph technology is the broader concept of representing and analysing connected data. A graph database is a specific type of database designed to store and query this connected information efficiently.
What is the difference between graph technology and graph algorithms?
Graph technology refers to the broader approach of storing, modelling, and analysing connected data. Graph algorithms are specific analytical methods that operate on graph data to identify patterns, such as important nodes, shortest paths, communities, or connections between entities.
Is graph technology the same as graph visualisation?
No. Graph visualisation is one way of exploring graph data visually, but graph technology includes the underlying data model, database, analytics capabilities, and methods used to analyse relationships.
How is graph technology used in law enforcement?
Law enforcement agencies use graph technology to connect information from different sources, analyse relationships between people and organisations, identify patterns in criminal networks, and support investigations involving complex networks of activity.
Does graph technology use artificial intelligence?
Graph technology and AI can be used together, but they are separate concepts. Graphs provide structured information about entities and relationships, while AI systems can use this context to support tasks such as search, retrieval, and analysis.
Can graph technology replace intelligence analysts?
No. Graph technology supports analysts by helping them explore connections, identify patterns, and understand complex information. Human judgement remains essential for assessing evidence, interpreting context, and making decisions.
How does GraphAware Hume use graph technology?
GraphAware Hume uses graph-powered intelligence analysis to help investigators connect information, explore relationships, and analyse complex networks while maintaining visibility of evidence, provenance, and context.